
The season is over and the finals is (checks wrist, realises no-one wears watches, races to computer, starts up computer, checks calendar, writes apology to clock wearers) just two days away. So, what did we learn from the 2016 AFL season, and more importantly what did the HPN system think of the teams involved in the games?
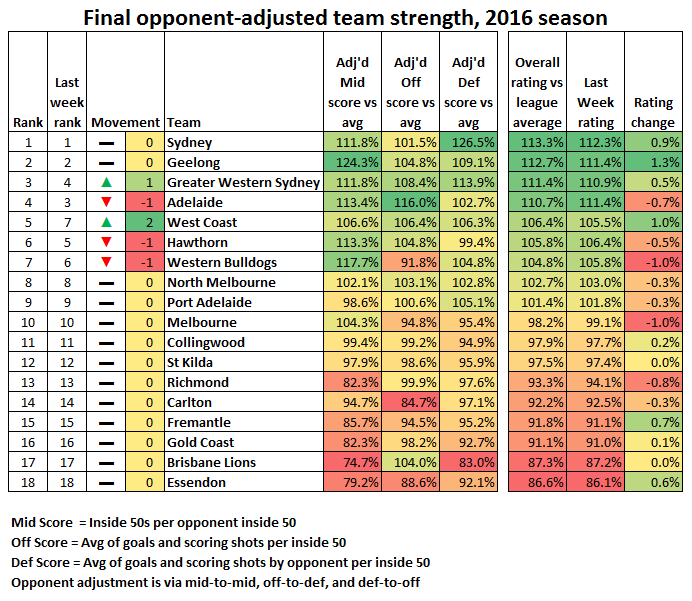
As we’ve been saying practically all season, this has been an incredibly tight season at the top, at least according to the HPN ratings. West Coast’s win propelled them up two places in our ratings, skipping over the Dogs and Hawks. GWS also rose over the Crows to finish the year in 3rd.
Adelaide’s last round capitulation to West Coast, coupled with Sydney’s dominating win over Richmond, has opened up the gap between the top four sides to 2.6%, which is slightly more than the lowest gap of all time. It’s still worth noting that the gap between the top four teams is still less than the gap between Adelaide in 4th and West Coast in 5th.
Not only does the top four stand on their own, but the next three teams seem a fair margin ahead of North in 8th and Port in 9th. There’s another 3% gap to the best of the rest (Melbourne, Collingwood and St Kilda), and the another 3% to the not-quite cellar dwellers. A fair way off the pace sits Essendon and Brisbane, nearly identical at the bottom.
How Does This Compare To Previous Seasons?
This data all looks nice and interesting, but what does it really mean? Are there similarities between teams this year and those in previous years? Magnets; how do they work?
To answer the two non-Juggalo related questions, we need to transform the data above into a historically comparable dataset, by shedding our opponent adjustment. While this sounds like a big deal, it actually has a pretty small effect on the data:
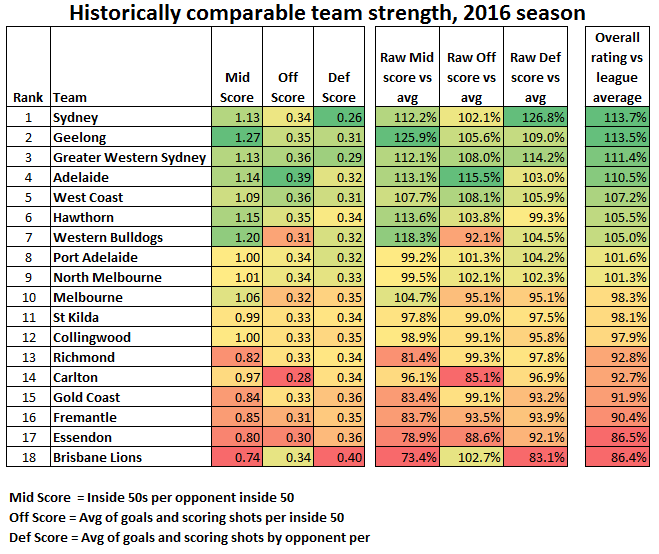
See, that was pretty painless. The major change is Port leapfrogging North into 8th after their draw weightings are stripped out.
So, let’s re-cap on some things we have peppered into our rating posts this year, as a guide on what we are looking for:
- No team with an overall rating lower than 105% of league average has won a flag (Sydney 2005 finished on 105%);
- No team ranked lower than fourth in their season’s overall ratings has won the flag (Sydney in 2005 finished 4th);
- Only two premiers have finished with a rating less than the league average 100% in any individual strength component (North 1999 [Defense 96.5%], Sydney 2005 [Offense 98.9%]).
When looking at the teams above, we can apply these loose and fast guidelines to cut through the teams remaining.
- North Melboune fail all three criteria for a premier, and are probably lucky to be in the finals considering the drama around their club right now (watch them make the Grand Final after we’ve ruled them out).
- The Bulldogs clearly fail the below 100% test on offence, with no team with a component rating even close to this low making the grand final. The Dogs also sit outside the top four rated teams, but they match the 2005 Sydney team for ratings.
- Hawthorn marginally dip below 100% for defense, but North have won a flag with a defensive rating even lower. However, they sit outside the top four rated teams.
- Finally, West Coast tick all the boxes bar one, and are a relatively balanced team except they sit a spot outside the top four rated teams. Hoever, the Eagles are about as good a fifth placed rated team as we’ve seen (watch them get knocked out this weekend now this has been written).
That leaves Sydney, Geelong, GWS and Adelaide as the rated premiership threats by the HPN system. The HPN system ignores the fact that Adelaide slipped to fifth on the ladder, and will have to win four consecutive finals to hoist the flag.
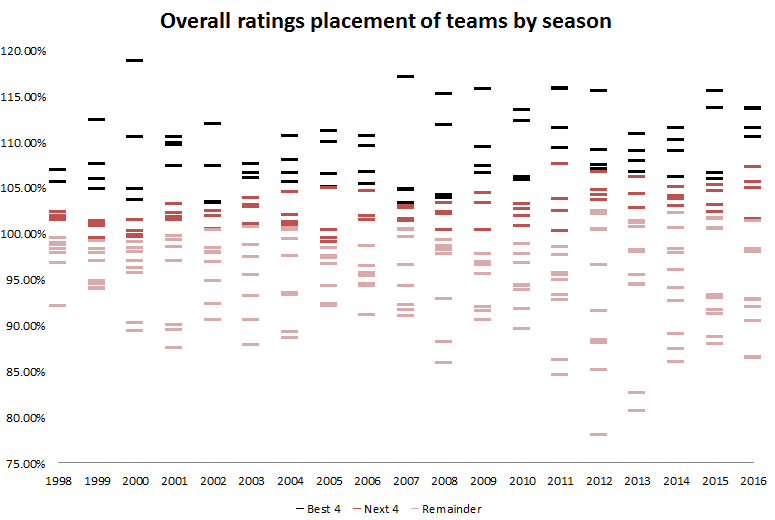
Finally, here’s a visual representation of how this year’s teams rank against teams from previous years, including previous grand finalists.
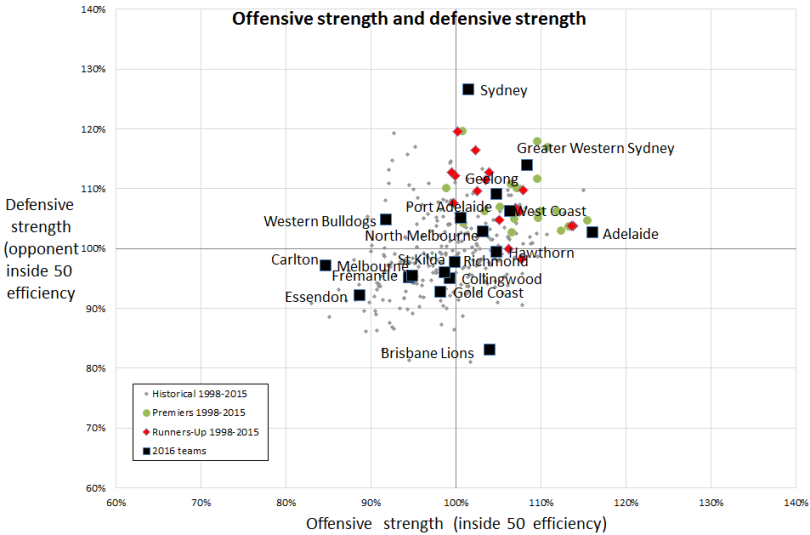
Sydney and Brisbane stand out here via their absolute isolation on attack and defense, and for good reason. By the HPN ratings, Sydney have just completed the strongest defensive season since 1998, clear of all historical comparisons (including several of their predecessors) by 6% in our ratings. The distance between Sydney in first and Geelong in third this year is more than that between Geelong and Essendon in 17th.
Brisbane, all on their lonesome at the bottom, just had the fourth worst defensive season of all time.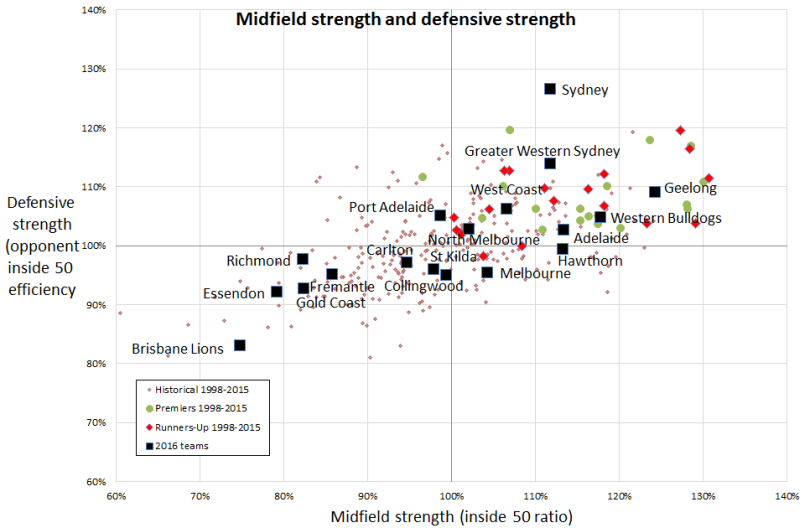
The midfield is really Geelong’s place to shine, with their rating of 126% good for ninth since 1998. Both of the top two teams on the list are grand finalist Geelong teams (2008 and 2011). The Dogs were shaping for most of the season as having a stronger midfield rating than Geelong, but they faded as the season went on (and as injuries piled up).
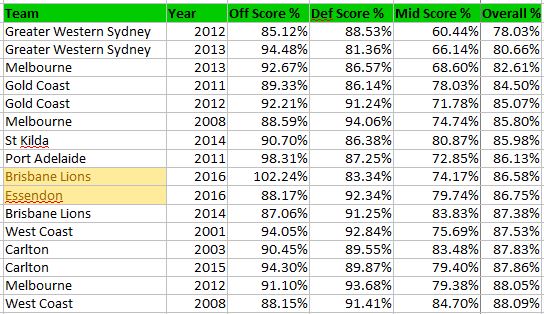
We don’t mean to pick on Brisbane, but they also finished with the sixth worst midfield score since 1998. It’s not all bad news though; their attack was above average. In fact, no terrible team has been as idiosyncratic in their badness as Brisbane this year. No team this terrible have had a part of the ground where they’ve been above the league average. The closest comparison is Port Adelaide in 2011, whose offensive efficency was nearly average:
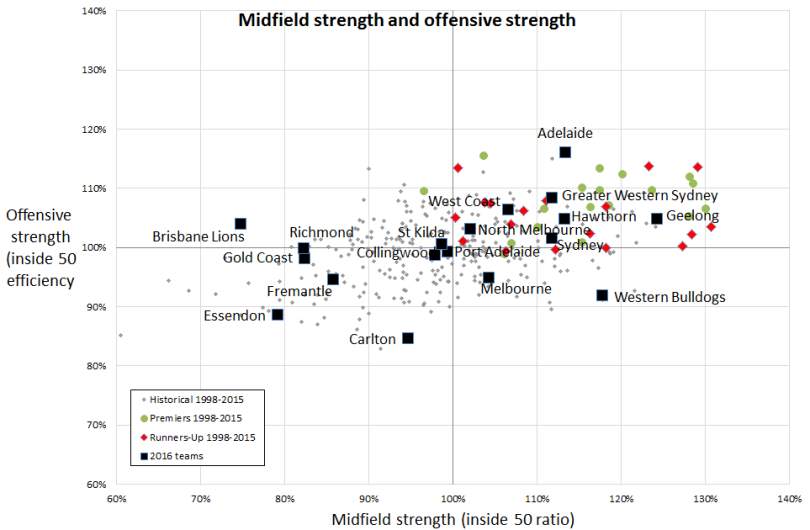
Attack is where Adelaide stands out, with the strongest attack since 1998 (the barest fraction ahead of Port Adelaide in 2004) . No side was within 7% of the Crows attack rating, with GWS and West Coast sitting firmly in second and third.
GWS have been extremely consistent across all three categories, with a very evenly balanced team.
At the other end of the chart, Essendon tries to prove that Brisbane shouldn’t have all the fun, and Carlton tries to show us that an attack shouldn’t be led by Matthew Wright and Andrejs “Still Drej” Everitt.