
The expansion of the Super Rugby to include teams from Argentina and Japan is fascinating from both a football business perspective and for the importance of the growth of the game. In this post we’re going to take a look at the structure of the new competition and then use a strength of schedule approach to analysing draw imbalance in Super Rugby. Tomorrow we’ll focus more on projecting the 2016 season and looking at the newcomers in detail.
Super 18
This year there will be three new teams, bringing the total to 18 and increasing the challenges of fixturing. The basic unit of analysis for the new draw will be two Groups, Australasia (10 teams) and “everyone else” (8 teams – 6 in South Africa along with the Jaguares in Argentina and the Sunwolves in Japan). Each Group is broken into two Conferences – Australia, New Zealand, Africa 1, Africa 2. The Sunwolves are in Africa 1 and the Jaguares in Africa 2. Here’s a diagram of how they match up with each other:

The quid pro quo in setting up the new arrangements is interesting, and are important to understanding the new structure. Essentially South Africa now have their desired 6th team but in exchange have taken on a disproportionate travel burden and lost playoff entry parity. 3 of 8 finals spots will come from the Africa group (ie 37.5% of teams will qualify), and 5 of 10 from Australasia (50%) will make it.
Who plays who
All countries get less intra-country games. Last year everyone played 8/16 games against fellow countrymen. Australia and New Zealand now play 6/15 such “derbies” and South African sides will be playing 7/15.
There’s more travel for everyone. The Jaguares and Sunwolves will obviously have the heaviest travel burden with every trip being long-haul. The Sunwolves even travel to Singapore to play 3 home games. This is a six-hour flight, roughly the equivalent of Perth playing home games in Auckland.
South Africa cops a disproportionate share of the increased travel loads. The South African teams will travel to at least one of Argentina or Japan every season, with trips to both countries every two years. This extra travel is mitigated by the fact that the South African teams play one or two fewer games in Australasia (down from four a season to two or three, depending on home and away balance).
Australasian teams should travel long-haul for just two games as previously, though this may mean two long journeys instead of the traditional extended two-game African leg, for teams going to Argentina or Japan/Singapore as well as to South Africa.
Who doesn’t play who
The Super Rugby has never had a fully equal draw due to the constraints of timeframe and geography. However the 2016 schedule has redistributed where the imbalances lie.
Where previously cross-country matchups were uneven (playing 4/5 teams from two other countries), now each team in a country/conference has the same set of external opponents. Each team in Australia plays the same five NZ teams and the same four African teams, and so on.
However, new imbalances have been introduced with important consequences for a playoff structure that seeds conference winners and wildcards.
Firstly, while each African team plays its three conference-mates twice, two return games are missing from within the Australasian schedule. Six games means each Australian side plays two other Australian teams twice, and the remaining two just once. This is significant because the winner of each conference gets top 4 seeding and a home quarter final. The imbalanced draws means some Australian and New Zealand teams have a weaker schedule of opponents than others and an inbuilt advantage in gaining top spot.
Secondly, each conference completely skips a cross-contentinental conference. This year, Africa 1 (the Stormers, Cheetahs, Bulls and Sunwolves) completely skips all the New Zealand teams. We’ll get deeper into conference strength in a moment but suffice it to say that avoiding all NZ teams means a much easier schedule. Since number 1 seed in the finals is decided from among the four conference winners by total points, avoiding the highest quality quarter of the competition gives a South African team a big boost for as long as New Zealand remains a stronger set of opponents.
Thirdly, 15 games means some teams get seven home games and some get eight. In a competition with such long travel, diverse climactic and altitude conditions and parochial crowds, this must be significant. One analysis we’ve read puts the impact of home ground advantage at over a try a game for most teams.
The old competition was not even either
As we mentioned above, the scheduling of teams in the 2015 Super Rugby was not completely even. So criticism of the 2016 format for unevenness must bear in mind that previously, big imbalances existed. (Incidentally, if every team played each other once, in the most plausible completely even draw with eighteen teams, that would be a 17-game season and so there’d still be unevenness in the number of home games each team plays)
Imbalances in 2015 existed in two ways intrinsic to the “8/4/4” matchup structure – teams played more intra-country games than cross-country games, and everyone skipped a team among their set of cross-country opponents. This impacts on the fairness of the competition and we can quantify how much.
Below is a chart of Strength of Schedule, calculated two ways. The first is from the win-loss records of each team’s opponents relative to an even schedule (ie 0.500). The second a measure based on the total season score of all of their opponents, the logic being that the more their opponents scored, the stronger they are, and that high scores are also reflected in bonus points in Super Rugby.
This table illustrates the impacts of the draw imbalance in 2015:
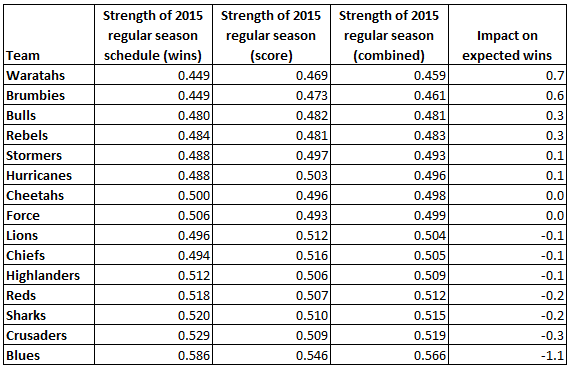
The Strength of Schedule compares each team’s opponents to a hypothetical situation of a completely average team playing every other opponent the same number of times. Above 0.500 means a team had a stronger set of opponents than this benchmark, below 0.500 means a weaker set.
The Waratahs and Brumbies had the easiest schedules, with their opponents winning an average of 44.9% of their home games (and the Waratahs’ opponents having slightly less scoring proficiency). This reflects that they only played four games against the stronger New Zealand teams, and that within a weak Australian grouping they did not play themselves. It’s also a reflection of having avoided reasonably strong teams in other countries. The Waratahs skipped the Bulls and Chiefs, both ranked 3rd within their countries, while the Brumbies skipped the Hurricanes (ranked 1st) and Sharks (ranked 4th).
By contrast, pity the Blues whose opponents won 58.6% of their games and amassed the most average points of any team’s set of opponents. Not only did they play four stronger Kiwi teams twice each, but they only avoided the Reds and Sharks, both the second-weakest teams in their countries. Similarly note that the Crusaders were 0.9 wins behind the Brumbies based on draw alone.
We can use this to assess the impact the draw had on the 2015 Super Rugby standings:
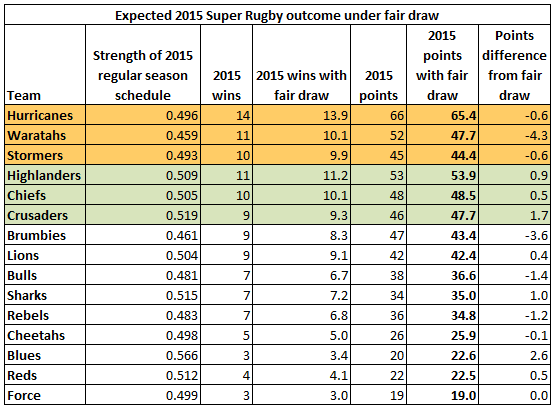
We can clearly see the impact the draw had on the standings. In reality, the Brumbies made the finals at the Crusaders’ expense by a single bonus point, both having nine wins.
Here, absent the benefit the Brumbies gained by reduced exposure to tough games, the Crusaders (who had the second toughest schedule in 2015) instead make the finals. On total wins, without factoring in bonus points, the Brumbies even fall below the Lions.
Notably, the four strongest teams all turn out to be in New Zealand, with the Waratahs and Stormers only getting second and third instead of fifth and sixth due to the advantageous seed allocated to the country conference winners.
At the foot of the ladder we can see the Blues rising above the Reds on a 2015 fair draw.
Stay Tuned
Above we described the 2016 competition format and noted the imbalances in the draw structure, and then illustrated the impact of an already-imbalanced draw on the 2015 season.
Tomorrow, we’ll bring those two threads together. We’ll quantify just how uneven the four 2016 conferences are, and then use this analysis to make some predictions about 2016. We’ll also spend a little bit of time talking about the newcomers to the Super Rugby and their prospects.
2 comments