
We’ve already run our eye over the 2016 Super Rugby seasons, and the current NRL season, so HPN decided to throw caution to the wind and attempt to predict the 2016 AFL season.
Like last season’s prediction, this projection shouldn’t be used as exact gospel on how a team should perform in 2016, but more of a general indicator on whether they should improve or decline compared with last season. The method deliberately constrains itself to a few measurable thing and, most notably, entirely omits new recruits and departures from consideration.
The method relies more on the simple than the statistically complex, however it did a reasonable job at predicting the movement of teams last season (with a few notable exceptions). After last year’s results, we’ve made a few tweaks to the formula that we hope will increase the accuracy. To kick things off, here’s what we came up with:
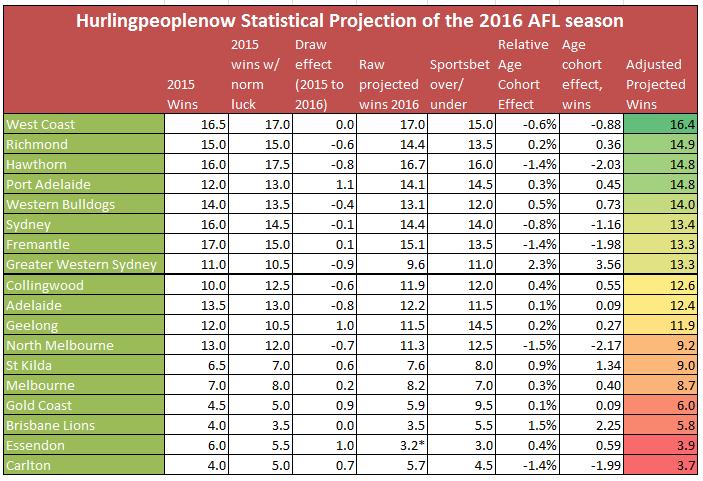
To compile this prediction, we have relied upon three measures: strength of team, strength of schedule and expected improvements/declines of each list due to aging.
Strength of Team
To account for the true strength of each team, we will take their 2015 performance at the key indicator and make a couple of minor adjustments.
Firstly, we looked at each teams’ results in close games last season. After an analysis of all close games within the last three years, we have found that there appears to be no real discernible pattern to a team’s performances in close games.
Close games averaging out to 50:50 means that teams who performed exceptionally well or poorly should expect to be subject to regression to the mean. We’ve given each team “normalised” luck in projecting their 2016. For example, Sydney, who went 4-1 in close games last year, can expect to do 1.5 games worse in such contests if their luck regresses to the mean.
Strength of Schedule
Recall that we used Strength of Schedule to assess the 2016 fixture’s difficulty in this post. Here we’ll use that same assessment to adjust expected wins for each team. Here’s a nice little table to jog memories:

For example, Adelaide can expect to do nearly a full win worse this year, all things being equal, just by virtue moving from a slightly soft draw to one of the roughest in 2016.
Effect of aging
Finally, we will look at the age profile of each list, and what teams will benefit (or suffer) due to the model aging curve. Some time ago, we calculated the expected output for each age cohort of AFL player.
In these projections we’ve applied this output curve to all players on each list with 15 career games under their belt and who were at the club last year, to measure the expected improvement from a pure “cohort ageing effect” in their continuing players. Below is a chart of that age effect in relative terms, for each team in the league:
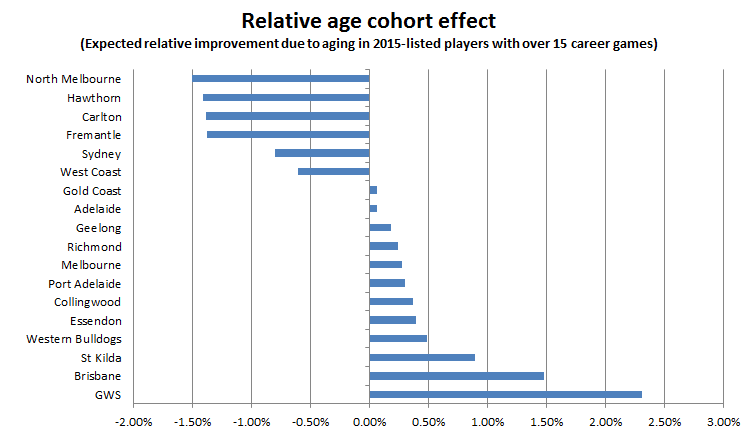
Noteworthy here is that Carlton appears to have a continuing list that is already old enough to have little expected to improvement than most other teams. They’re in a category here with the likes of contenders North Melbourne, Fremantle, Hawthorn and Sydney. That suggests either Carlton are in a deep hole with ageing dud players and a lot of renewal to do, or that their list has underperformed and could do a lot better just by virtue of its experience.
Last year, we believe we underestimated this effect, and as such we’ve adjusted our formula. Fundamentally, we believe that a 2% relative increase in output looks like it should provide have more than a 2% increase (about half a win) in total wins. This year, using the age effect we derived earlier, we applied the effect to each player on the senior list at the club. We have used the maximum senior list number of 40, as each club is able to have that many players on the senior list at any given time. The formula is as follows:
Season Age Effect = (Number of players on senior list ^ (1 + Relative Age Effect)) – Number of players on senior list
Where last year the maximum impact of the age cohort effect was about half a win, this year it’s around to two or three wins for the outliers. We’ll see if that tracks better over the year.
What we don’t measure
Please note here that our age effect is a measure only of continuing players – new players and departing players are excluded from this effect. Indeed, we have made no attempt to measure the impact of new recruits in this projection as a whole. This leaves a big Dangerfield-sized hole in our simple model, which must necessarily be filled in by subjective judgement beyond its scope.
Similarly we do not account for improvement coming from players with less than 15 games under their belt. There’s a decent chance some of these recruits (Callum Mills, or Jacob Weitering, for instance) make a difference but again, that’s beyond our scope.
The Essendon problem (and other last steps)
The most extreme example of the blindness to player change is Essendon. Thanks to their suspensions, Essendon are essentially a different team in 2016 to what they were in 2015, they present an interesting issue. Do we take their value as based upon the 2015 season, or instead impute a more realistic base value?
As our initial take on the suspensions noted, Essendon, in raw terms, lost half of its output from the 2015 AFL season. Going back to our data on cohorts of continuing experienced players, no other team underwent this amount of turnover of key players in the offseason, or even close:
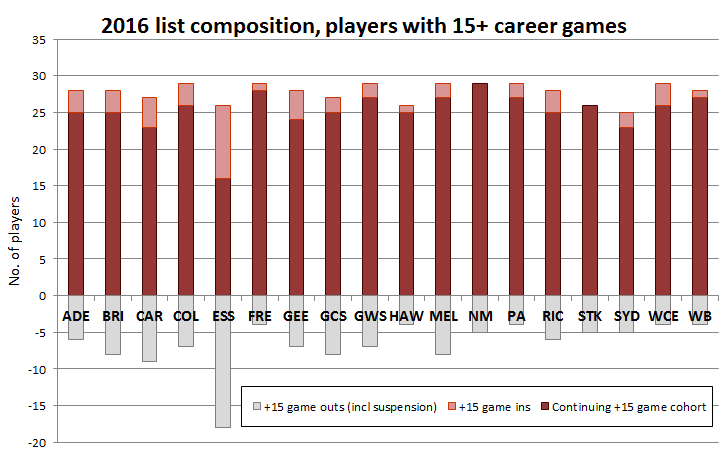
The simplest approach for us is to use the rough assumption that Essendon will be roughly half as strong in 2016 as they were last year to estimate their list strength in the place of their actual 2015 record.
Yes, they’ve replaced the suspended 12 but, coming from outside the AFL, those should be expected to perform similarly to the weakest players already in the system and offer basically no improvement. This is rough, and not exactly “best practice”, but is the fairest result we think we can achieve.
Finally, we have adjusted all of the results to make sure they represent a full AFL season of 198 games, which just involved some slight rounding at the last step and means numbers won’t quite add up.
Risers
Improvement on 2015 wins, rounded to the nearest half win
Port Adelaide (+3 wins)
We had Port in this column last year too, which didn’t work out well for us at the time. Port has a relatively soft draw this year after what turned out to be a murderer’s row of doubleups last year (that said, they rolled Hawthorn and lost to Carlton so draw isn’t everything). Like the other sides on this list they are a team that should be improving with age. We get them riding these factors back into the top 4.
Collingwood (+2.5 wins)
Collingwood lost a lot of close games last year, winning just one of seven games decided by less than two goals last year. They also have an ever improving list, one of the faster projected improvers in the league. They’ve recruited a number of young contributors in the offseason, but even without that being factored in, HPN predicts that they will do substantially better than last year as a result, and push for a spot in the finals (which we have being at 13 wins for the first time ever).
GWS (+2.5 wins)
GWS are in an enviable position right now – a team on the rise like few others in spite of a tougher draw. They have depth at almost every position, and more former first round picks than they know what to do with. We see their rise being meteoric this year, with this season their side to make the leap into the eight and potentially the four. The major complication to this is the loss of Cam McCarthy (likely for the season at this stage) and Jeremy Cameron for the first month. If they can do enough to replace their output for the first month, they’ll be on right track for this year.
St Kilda (+2.5 wins)
Firmly into their rebuilding project, St Kilda look to build on their unexpected improvement last season by moving another notch up the ladder. The Saints have an interesting blend of aging stars and emerging talent, but whether the blend is there this year remains to be seen.
Melbourne (+1.5 wins)
On pre-season form, the Dees should be firmly pencilled into the eight, but as we’ve written previously the pre-season means jack. Melbourne has a promising young list, and should be a contender to make the next step to finals contention. However right now we have them at the head of the bottom pack of teams, along with the Saints.
Brisbane (+1.5 wins)
Brisbane have a lot of issues, but their midfield is pretty good, at least on paper. Their projected improvement here is almost entirely driven by developing youth. If they can get some semblance of a tall target up forward, find a working defence, do a bit better in close games (or at least get in a position to be in close games) and keep their best 22 on the park, they should improve this year. It won’t be pretty, but better than the ugliness before.
Gold Coast (+1.5 wins)
To misquote Rodney Dangerfield, the Suns got no respect last year (from opposing teams). They stank the joint up, due to injuries and indiscretions. Given those things we can’t get a subjective read on how they’ll do this year. Not a clue. It’s hard to see them doing worse than last year though, especially with a couple of teams that seem destined for the bottom of the ladder.
Sliders
Decline from 2015 wins, rounded to the nearest half win
Fremantle (-4 wins)
Fremantle were the best team last season in close games, but as we said earlier, they are unlikely to repeat this performance this season. In tight games last year (less than 12 points), Freo went 5-1 – which made a large contribution to their minor premiership. The effect of aging also hits the Dockers, as players such as Sandilands and Pavlich head closer to the end. We have them on the edge of the eight, but by a very small margin.
North Melbourne (-4 wins)
North’s predicted decline in 2016 happens for almost exactly the same reasons we have predicted a decline for Fremantle above. Unsustainably good in close games? Check. An aging team? Check. But North have with the added disadvantage of a tough draw. This may seem a little lower than most predictions have for the Roos, but everything seems to be indicating a slide.
Sydney (-2.5 wins)
The final team in the old and lucky trilogy. All three teams could outperform expectations, but if you’re looking for sliders from last year’s finals series these three teams are a good place to start.
Essendon (-2wins)
¯\_(ツ)_/¯
Adelaide (-1 win)
Adelaide slides slightly due to their tough draw and record in close games last year, but with Collingwood, Fremantle and Sydney should fight for a spot in the finals. Note again that we have not incorporated any Dangerfield related variables into this projection.
Geelong (-1 win)
Geelong were really lucky in close games last year, which masked their downfall slightly. Their offseason recruitment is widely expected to help their performance this year, and that’s something we simply have not incorporated into this simple projection. In addition, benefits obtained from the maturation of their list should be only about middle of the road. The factors we include here suggests that they shouldn’t be expected to do much better than they did last year, so any improvement will come from their new headline recruits.
Hawthorn (-1 win)
Hawthorn are getting older, and their draw is always going to be tough as long as they continue to finish at the top of the ladder. That is the weight of success. They will continue to do well.