

Earlier this week, Rohan Connolly wrote a piece about the state of AFL attendances centred around Collingwood getting their lowest crowds since 1940. His overarching thesis is that recent AFL experimentation with the fixture, specifically in 2014, has disillusioned the MCG-going public, and has caused crowds to be more fickle, and thus led to an overall decline in numbers by a couple of thousand per game.
The evidence offered for this is that the MCG had higher attendances in 2010-2013 than it has done more recently. There’s also an implicit assumption from the tone and the attribution to the impact of TV rights that crowds more generally must be in decline.
We don’t really buy any of this. Instead we think what is happening is just the cyclicality of crowds and form. Specifically, we think Victorian crowds get larger when there’s a critical mass of Victorian teams doing very well. Which, currently, there isn’t.
Below is a chart showing, team-by-team, each year’s home crowd as a percentage of that team’s average since 2000:

2007-2010 was the peak period for average AFL crowds, and even removing the two expansion sides, total average crowds have not returned to those levels.
But have a look at the teams which hit peak crowds in that period. Collingwood, Carlton, Hawthorn, Geelong, St Kilda and the Bulldogs all hit their crowd peaks at some point in that period. Essendon’s crowds were also higher than more recently now. Even Melbourne and Richmond were far from their lowest ebb in crowds despite onfield struggles.
This was a period when the top four and top eight were mostly Victorian sides. In 2008, 09 and 10 the top 4 was four Victorian teams and only two non-Victorian teams made it to the finals. Crowds swelled off the back of that, and we’d contend this is partly because of the feedback effects between teams when you have a city with nine teams. More top sides means more high quality Victorian derby matches and that is enticing to both fans of competing clubs and to neutral fans.
We can see this Victorian in charts of average and total state attendance too:
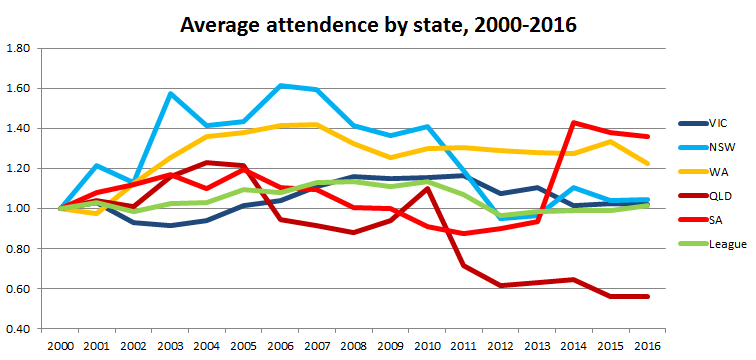

In terms of the other states, we can see that both NSW and Queensland are getting more people to games than before expansion, but average attendance per game has declined a long way due to the small GWS and Gold Coast crowds. South Australia shows the massive impact of the move to Adelaide Oval. Western Australia has sat pretty steady since 2004 or so when Fremantle stopped being terrible – they are impacted by caacity constraints and we can anticipate a big jump when they move to Burswood.
But for Victoria the dominant influence from a much larger sample appears to be the collective form of their teams. Note that the decline for Victoria started before the 2014 fixture experimentation that Rohan Connolly blames for driving fans away in enduring way.
Essentially, in 2015 and 2016, total and average Victorian crowds are pretty similar now to the period in the early 2000s. This was a period when Brisbane, Port Adelaide, Sydney and West Coast were winning premierships, Adelaide and Fremantle both made preliminary finals, and most years only a small number of Victorian clubs were flying the big V.
The fact is that today we’re in a similar period where more interstate teams than Victorians are occupying the top rungs of the ladder. Sydney, Adelaide, Fremantle, West Coast and Port Adelaide have all made preliminary finals since 2012. Several along with GWS are threatening to do so again this year. In that same period only Hawthorn, Collingwood, Geelong and North Melbourne have done likewise and only the Bulldogs from outside that group can this year.
Notably, Collingwood, Carlton and Essendon are nowhere to be seen.
This resurgent interstate preponderance among flag prospects is probably being obscured in the popular imagination by the giggling giant that is a dominant, all-conquering Hawthorn. But Hawks crowds are attenuated by Launceston home games and have never actually gotten back to their 2008 peak. We’d suggest part of the reason for this is a dearth of quality local rivals.
The chart below shows the composition of total AFL attendance by each club’s home games. It illustrates the large contribution made by the popular Victorian sides and should help to show the extent to which different teams generate different crowds.

In short, if you want to know why MCG crowds are lower now than 5 years ago, look at the ladder. Ask how many usually high-drawing teams are attractive prospects to go and see for their own fans. Ask how many Victorian derbies will draw a lot of optimistic away fans. What games will draw neutral football lovers keen to see a great contest.
It’s time to turbocharge our zesty finals reform takes
Sometimes we suspect people write silly things on the AFL website just to prove its independence from the AFL marketing department. That’s certainly the best explanation for Sliding Doors but this week our attention was drawn by this piece on doing -something- to the fixture and finals to work around the fact that we already know the ninth placed team can’t make finals.
The complaint is essentially that by mid-year too many teams know they can’t make finals. The proposed solutions are either a return to the 17-5 well and/or a five-week ten-team finals system which labels 9th and 10th as “wildcards” and makes 7th and 8th play them before travelling to play 5th and 6th.
The article argues “we have had a final eight in a 15-team competition so we can have a 10-team finals series in an 18-team competition”. It is certainly true, that is a thing which would be possible. But it would also be a remarkable departure for the AFL both practically and theoretically. For all but 8 years of the VFL/AFL’s history no more than 50% of teams made the finals. From 1898 to 1900, every team played in the finals, and there was the pre-Port Adelaide final 8 years. There was also 1916 and 1917, affected by war.
We acknowledge that top-ten finals systems can exist, but to our knowledge they’re not particularly elegant. Most sports with post-season tend to max out at 4 stages of finals and either 8 or 16 participating teams. And once you go above 8 teams, a system seems to require pure sudden death or a fifth week. Such five-week systems will also likely involve two byes for winning top sides, which probably isn’t actually an advantage.
More to the point though, the fact that there’s likely no hope of the gap between 8th and 9th being bridged this season is almost entirely a random outcome from year to year. In other seasons, with other strength distributions and other draws, we get very close races to the finish for a number of teams. We get 7th completely safe and then 5 sides in a cage battle for 8th. Or we get three sides contesting for the last two spots. Or we get a team crashing hard at the end of the season and clearing the way for someone else.
Even now, there’s the hope that West Coast or North Melbourne drop their bundle or Melbourne, St Kilda or Port Adelaide start winning a string of games they might be expected to lose. There’s plenty of interest to be had in death-riding teams at the bottom of the eight, and we’d also suggest that for St Kilda or Melbourne or Carlton fans, the likelihood of missing the eight isn’t going to discourage them from paying attention. Sides like them show that 9-12 bracket of teams is usually filled with plenty of hope.
Things to watch this weeken
1. For the Swans and Bulldogs, the alphabet starts at D.
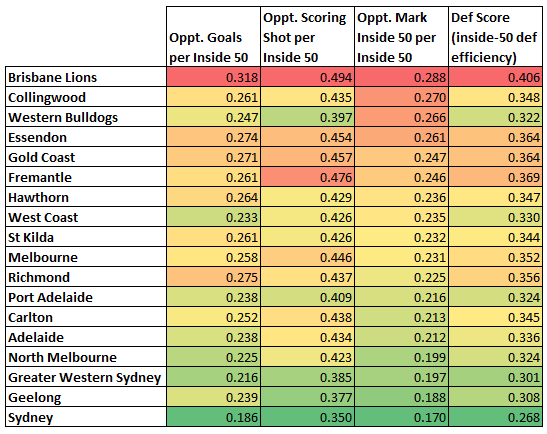
Most of the punditry this week has focused around the battle of the “two best defences” in the league, the Swans and the Bulldogs. The two sides are number one and two for points conceded this year, and this holds when adjusted for pace (total scoring) in each team’s matches:

Each side has had significant issues with injuries down back, and could conceivably be even better if fully fit. The Dogs defense is really anchored by its midfield strength. Its midfield wins the most lopsided share of inside-50s in the competition, with its denial of the opposition’s ability to win the ball key to drying up scoring opportunities.
The Swans, however, are excellent (the best in HPN’s statistical records) at denying teams any scoring once the ball is inside 50 (the trait measured by our defensive score ratings).
The Bulldogs have one glaring weakness down back, and one which we’ve pointed out before:
One would think that if the Swans can come close to breaking even in the midfield, their stingier defending should carry them home.
2. The Irwin Medal heats up
The Irwin Medal will be awarded to the player who has the most prolific, yet inaccurate, season kicking for goal. The criteria is a minimum of 30 scoring shots and right now Matthew Pavlich and Daniel Menzel are neck and neck behind Orazio Fantasia whose 1.1 last night brought him into contention:
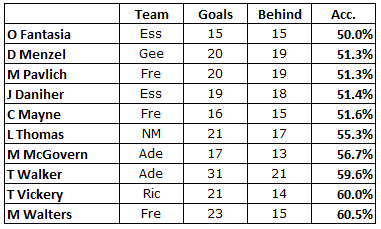
However there is a chasing pack led by Josh Schache whose 28 scoring shots have gone at 46% accuracy. Two goals will bring him level with Fantasia, a goal and a behind will put him in the lead.
We’ll keep this updated periodically whenever we need cheap content.