
This week we’re going to take a look at the question of how reliant teams have been on particular goal kickers. The specific spur for this is the talk of Sydney being overly Franklin-centric but the question is worth looking at more broadly – how much heavy lifting do each club’s top goalscorers do?
First let’s look at total goals scored: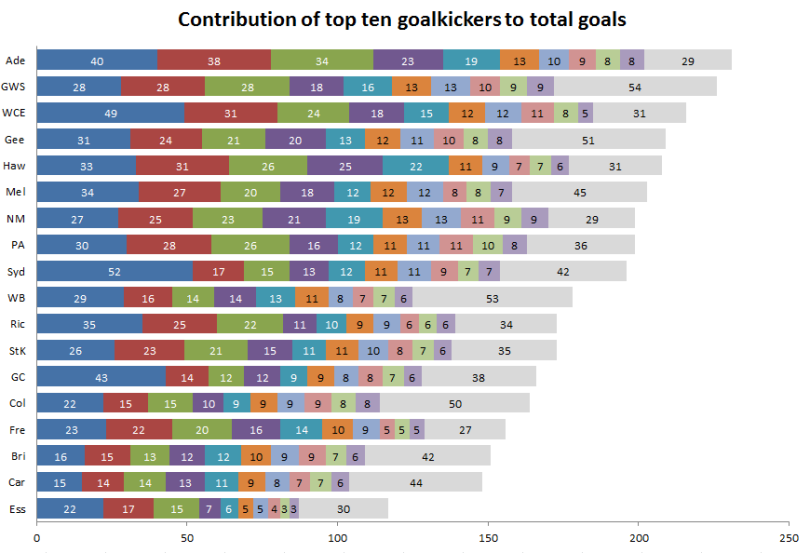
One thing that shows up clearly here is the sheer dominance of the Crows’ four forwards. Collectively they have outscored everyone else’s best 4 goalkickers and even the top 6 of every club except West Coast and Hawthorn. They’ve also outscored the entire Essendon Football Club. Hawthorn have a top 5 (Gunston, Breust, Rioli, Puopolo, Sicily) with similar output.
Below is the same information presented as proportions.
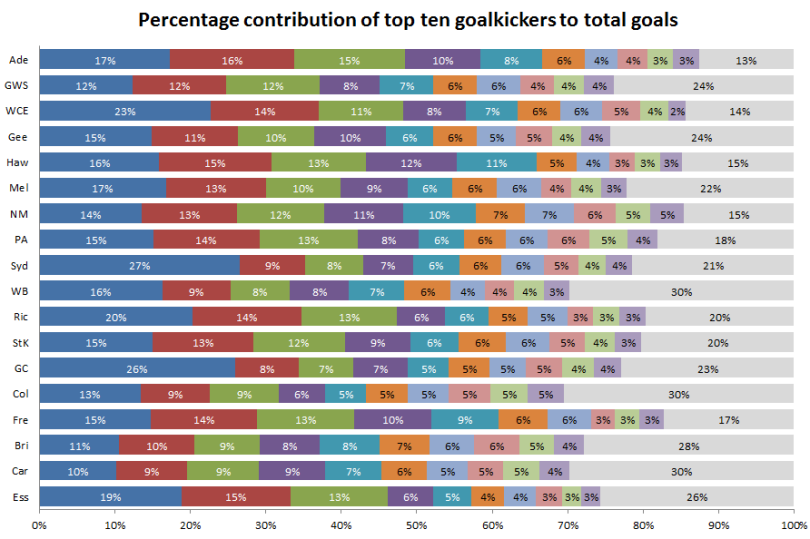
Sydney do indeed show up as quite relatively reliant on the game’s best forward, with Franklin scoring a full 27% of their goals though him. Notably, 3 of the other 6 Swans players in double-figures for goals this year (Heeney, Tippett, McGlynn) won’t be playing against Geelong while Papley comes in for the first time in a while. While Franklin is entirely capable of winning games off his own boot, this lack of secondary output still strongly suggests a problem. Sydney will want to start finding more goals from alternative avenues over the next few weeks while waiting for Tippett and Reid to become available.
However, we do caution against the idea that only Sydney have a concentrated goalkicking output. Looking at the degree of concentration of goalkicking at each club among those who have scored goals this year, calculated using Gini coefficients (the same thing used to measure income inequality in countries), we can see successful clubs occupy a number of points along this spectrum:
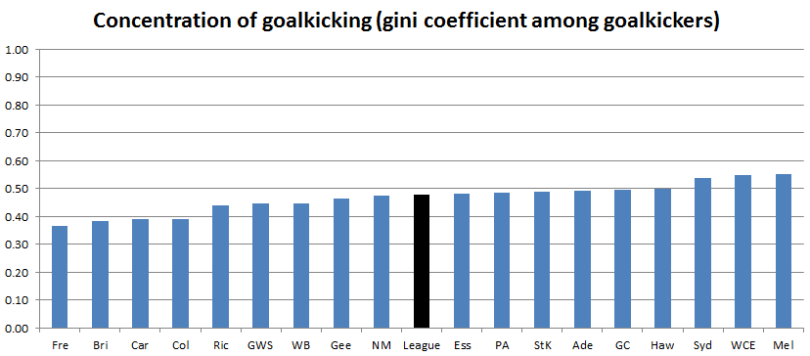
(1.00 would be a perfectly concentrated goalkicking side, where one player kicked every goal, while 0.00 would be every player kicking the same number of goals.)
We can see the league’s top sides sitting at different points along this spectrum. Geelong, North and the Bulldogs have a relatively even spread of goalkickers in their ranks. however, Hawthorn and West Coast, despite their lesser reliance on their number one target, still show about the same degree of concentration in their goalkickers overall. They, like Sydney, seem to have relatively defined avenues to goal.
There may be a suggestion in this chart that there is such a thing as too much spread – bottom sides without any dominant goalkickers fill out the ranks of the league’s most egalitarian sides. Overall though, we don’t think we can make inferences solely from how concentrated a club’s goalkicking is. We’d suggest the issue for Sydney is more about overall efficiency and production, rather than the count of goalkickers – the concentration of goalkicking in Franklin is more symptom than cause here.
Getting serious about concussion
The AFL just released its Injury Report for 2015 (PDF). We can learn from it such things as:
- clubs average about one new injury per senior player per year (37.7 to be exact)
- groin and quad issues are recurring much less often in recent seasons
- with an incidence rate of 0.7 per club, any more than one ACL in a season is unlucky for a club
- hamstrings are the most common injury in the AFL.
But clearly the most startling observation is to do with the recent trends in concussion:
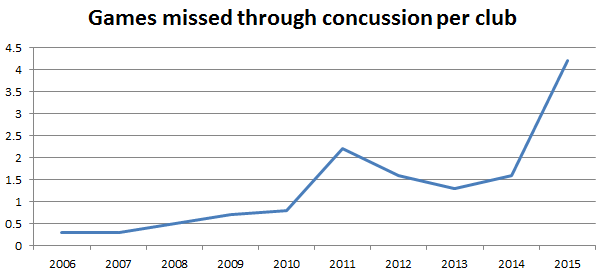
Without any serious increase in concussion occurrence, games missed per season from concussion shot up to 4.2 per club in 2015 from 1.3 in 2013. The rate of games missed was only 0.3 games per club in 200 – that’s a 1400% increase in games missed compared to a decade a go. In other words, we’ve gone from 5 games missed league-wide to over 4 games per club.
Things to watch this weekend
1. Battle of the Clones
Working from statistics, if you were to describe North Melbourne and West Coast, it would be: dominant ruck divisions open up play for a kick-heavy midfield which targets a plethora of active tall and small forward targets. We’ve got a number of team-based statistical measures that we track at HPN, and they largely indicate that both sides are the same freaking team.
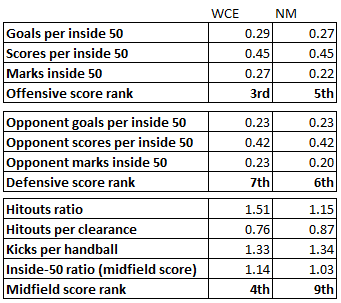
Naitanui’s absence does create a point of difference, as West Coast’s back-up rucks (as The Arc pointed out here) are not in the same league as Goldstein . Which makes sense; considering NN is a gamebreaking former All Australian and the other ruckmen are not.
West Coast, however, have had an edge in the midfield. The Eagles have a 4% edge across the season to date in clearances won, and a 10% advantage in inside 50 ratios. Across a standard game between two teams that are so tight, the extra couple of clearances and handful of inside 50 opportunities could be the difference between a tight win or loss. The question is how dependent this was on Naitanui initiating things.
It’s quite possible that if the Eagles do win this game their place in the eight will be relatively safe, and the Roos could come under threat from the Power (despite their loss last night). Currently West Coast sit two games clear of Port, and North three clear, however North and Port play each other next week. Next week we will dive into the run home for all three sides, but this is something to definitely keep in mind when watching this one.
2. Tragic Number and Magic Number
If Brisbane lose to the Suns this week, the Lions will officially be the first team knocked out of mathematical finals contention this year. CONGRATULATIONS! If they somehow manage to win their game, and the Eagles lose to the Roos, then the Dons have a chance to get the “first eliminated” mantle instead.
With 8 games remaining and a 32-point gap between the Eagles and the bottom sides, it’s still possible with some heroic assumptions about margin (think ten goal wins and losses every week) for the Lions or Dons to catch the Eagles.
If the Eagles manage to win this week however, both Brisbane and Essendon will be knocked out. Their Tragic Number will hit 0. No doubt their focus will then finally move to next season.
At the other end of the table, the Magic Number for the Hawks is now just 2, with the Hawks sitting 5 games clear of Port Adelaide with 7 games remaining. We’ll keep a Tragic/Magic Number watch in this place for the rest of the season as teams start clinching and being eliminated from contention.