
Given the AFL’s insistence on scheduling Thursday night games, Round 17 has already begun with Hawthorn pipping Sydney in yet another close win (and a fourth last-moments defeat for the Swans).
A bit of a narrative has emerged from that game regarding Hawthorn as a “clutch” team and we want to just subtly dissuade our readers from buying too much into the idea that either: a) the best teams have a talent for doing better in close games or b) winning close games is associated with subsequent premiership success.
We stand on the shoulders of Matter of Stats here who has pretty conclusively demonstrated that successful and unsuccessful teams win close games at similar rates. As Tony puts it: the evidence for the proposition that successful teams win more than their share of close games is weak at best. He’s also had a look and found very little effect from narrow wins or losses on subsequent performance.
What we want to contribute is a couple of graphs and a discussion of some specific teams. Firstly, here’s a scatter plot of the records of every team in every season of football since 1997.
Note that close games are defined as margins 12 or less. We figure that anything that could be decided by two more, or less, scores qualifies as a close result and pretty close to random.
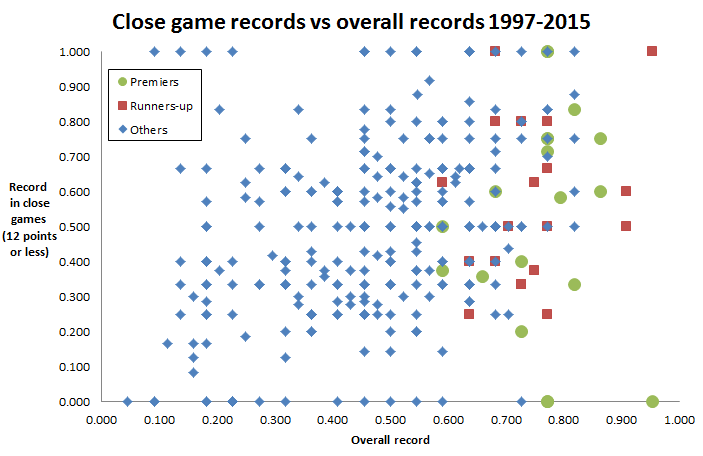
It turns out that, yeah, the hypothesis that close games are random is pretty close to the mark. The R-squared on this is garbage, as you’d expect, but more relevant is the number of high quality teams over the years who have struggled in games with narrow margins. Since 1997, ten premiership sides have won better than half their close games. Eight won less than half and the Crows in 1997 went at exactly 50%.
Hawthorn themselves last year went 20% (1 and 4) on their way to a premiership. This of course presents a problem for the “clutch” team narrative. In previous years they went 25% (1 win, 3 losses) in 2012, 60% (3 wins, 2 losses)) in 2013 and 100% (4 wins) in 2014. It’s almost as if these results are a bit random.
The thing with close games is that they’re largely a coinflip. And no matter how many times you flip a coin, the chances it comes up tails next time is 50%. Geelong in 2014, for example, had unprecedented luck, going 100% from close seven matches during the regular season, which represents an almost unprecedented level of “clutchness”. Yet when it came finals time, they crashed out in straight sets including by just 6 points in another coinflip match against North Melbourne.
Perhaps the most startling example of a truly great side struggling in close games, and yet still winning when it mattered, is the all-time great Brisbane Lions team of the early 2000s. Across their premiership years, they lost nearly all of their close regular season games. They won 2 games by 12 or less, (both in 2003), had a draw, and lost 9 by 12 or less. That’s a win-rate of 21%.
The fact is that good teams do a lot worse in close games than they do in non-close ones, and vice versa for poor teams:
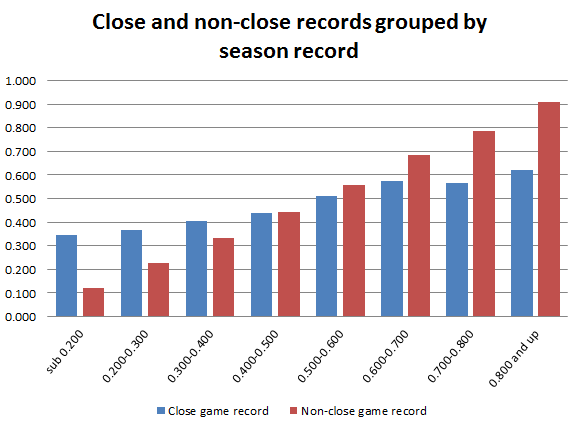
To emphasise – even the worst teams win a third of their close ones, and the top teams only win about 60% of them. This is despite a significant auto-correlative effect in these categories. That is, winning close games will move teams into a higher win/loss bracket on this chart than they’d otherwise be. So a lot of the teams with 80%-plus records are only distinguished from the next bracket by how their close results broke. In fact only Essendon 2000, Geelong 2007 and Collingwood 2011 are in the 80%-plus bracket solely on the back of bigger wins.
Hawthorn in 2016 stand as one of the strongest premiership favourites even if they often haven’t been as impressive as previous years. Their luck in getting wins from close games rather than losses has helped strengthen their ladder position for a charge at the flag.
But that doesn’t mean they are more likely to win the flag because of a special talent for close games. Such a talent cannot be demonstrated statistically and is undermined by Hawthorn’s jumpy close game results in previous seasons. Such a talent is unlikely to exist given the weight of evidence that close match results are a random walk regardless of underlying team quality. After all, the historical evidence is that the premier is about as likely to be a team with a 50% or worse record in close games.
Tall Defenders Can’t Tackle
With everyone talking about the potentially upcoming sequel to Space Jam (imaginatively titled Space Jam 2), HPN thought it could contribute to the hot-once-again genre of the sports film. You see, we were pouring obsessively over the numbers this week, as HPN does, and we found a disturbing trend:
Tall Defenders Can’t Tackle.
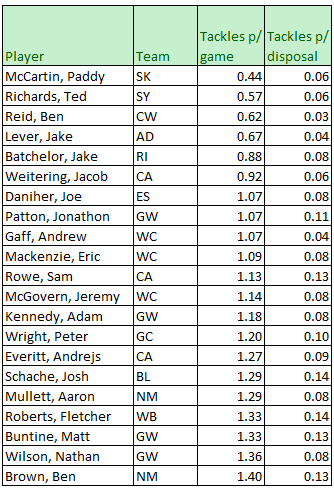
This is a list of the lowest tackles per game, minimum seven games played so far in 2016. As you can see, tall defenders dominate this list. This is primarily because their duties don’t often require them to lay tackles, and instead to operate mostly in the air. Similarly, look at the list of mostly grounded players that dominate the in tackles-per-disposal list:
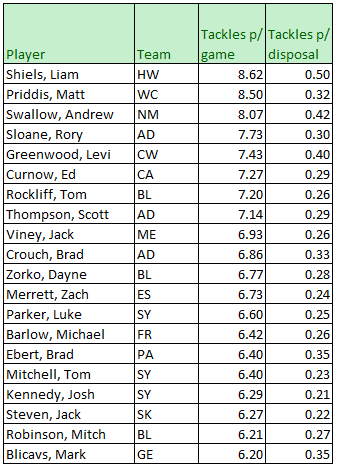
Following Occam’s Razor thismakes sense – talls work in the air, smalls work on the ground. Except for Shane Mumford, who is a human battering ram.
Call Disney, get Dreamworks on the phone. We finally have a sequel to the much ballyhooed Woody Harrelson and Wesley Snipes film “White Men Can’t Jump”. It’s about a tall defender who lays a bunch of tackles in games of “street football” and leads his team to success in an underground football tournament. It’ll open huge. Call our agents.
Or maybe not.
(Note: one of us wants it known that he utterly disowns this joke)
Things to watch this week
1. North vs Port matters a lot
This could actually be the most important match of the remainder of the season. It’s a massive call given the intra-top 8 clashes coming up, but it could still be true. If North Melbourne beat Port Adelaide this weekend, then the top eight are all but locked in. Sure, there will be jostling for positions elsewhere, but the gap between the September haves and have nots for 2016 will be all but carved in stone.
But if Port Adelaide wins? Things get a little bit interesting. The gap becomes 2 games and not much percentage, with North yet to play the Bulldogs, Hawthorn, Sydney and GWS among top-7 sides, while Port face GWS, Sydney and Adelaide.
Per our ratings, they look evenly matched:
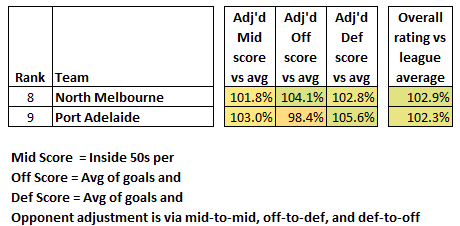
The teams match up oddly next to each other. Port Adelaide have lost much of their tall firepower, struggling mightily in the ruck and with marking targets. By contrast, the strength of North comes in their talented ruckman (Goldstein) and stronger forward line. Port has a relatively good defence, especially in recent weeks, while the Roos struggle a bit touch more.
In spite of the ruck contrast, both sides have nearly identical midfield strengths according to our metrics (inside 50 ratio and clearance ratio). Both sides prefer to use by foot instead of hand, and both sides limit opposition uncontested marks quite well.
2. Sydney are probably about to drop to about 7th
Such is the cutthroat nature of the extremely tight top part of the ladder, that having just dropped another close game with top spot on the line, Sydney can instead expect to sit 7th by Sunday night.
The reason for this is the peleton behind them all have pretty soft draws. Assuming results go as expected, the Crows (vs Collingwood) and Bulldogs (vs Gold Coast in Cairns) will jump Sydney on wins.
West Coast (vs Carlton), Geelong (vs Fremantle) and GWS (vs Brisbane) all sit a game behind Sydney and within 3.5% of them on percentage. If those teams can score over a third more than their opponents, they should all push their percentage past the Swans’ 135.50% and therefore leave the Swans ahead of only North Melbourne within the top 8.