
Earlier this week HPN took a look at AFL club revenues in 2015 to see how much money each AFL club makes. In this post, given the context of the financial equalisation debate, we’re going to look at how AFL club revenues under the equalisation arrangements of some other prominent sporting leagues.
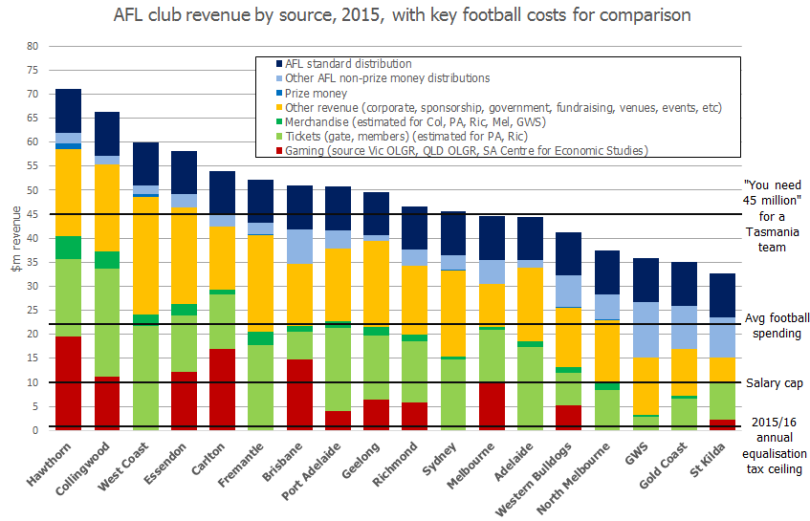
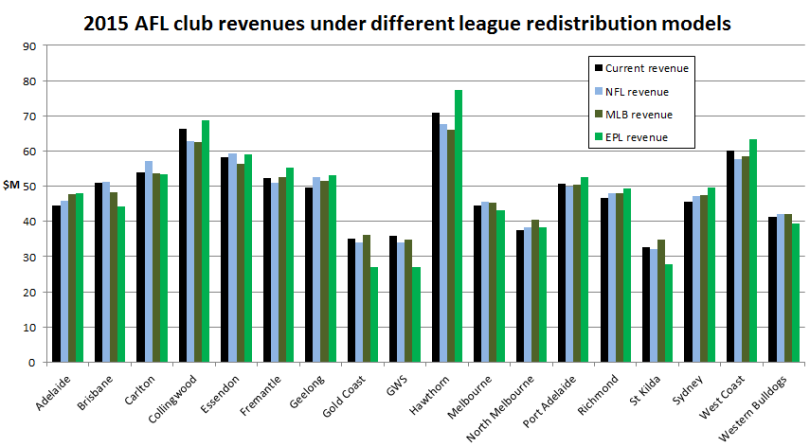
First, as a reminder, below is how the league currently looks. For an extensive discussion of these details please see our previous post.
How does the AFL do financial equalisation?
Currently, AFL clubs are given a number of distributions from the AFL. Most significant is the equal share of TV money all clubs receive, but there are other pots of revenue that also get given to clubs, either to compensate for inequalities or to fund specific ventures.
Clubs get to keep all the revenue they raise themselves, be it from sponsorship, corporate support, membership season tickets, gate takings, or merchanise. There have been some recent, limited experiments in imposing a spending-based redistribution, with clubs to be taxed for their off-field, football-related spending above a certain cap. So far the takings from these have been limited – the chart above shows the small size of the maximum $1m taking from each club.
The thing is, a spending-based cap is of course easy to work around, so it may work better as an effective limit on spending rather than on actually being redistributionist. If financial leviathans (HI RYAN!) Hawthorn are restructuring to avoid paying it, it clearly isn’t going to raise much revenue to support the smaller clubs.
However, it appears that most leagues around the world attack financial redistribution from a revenue side and not a spending side.
How do other leagues level the financial playing field?
Let’s start with one of the biggest sporting leagues in the world, and a sport generally used as a model for much of the AFL’s corporate behaviour.
The NFL has 32 teams based all across the country, from two teams in monolithic New York to one in tiny Green Bay. Whilst the dollar values are at times cartoonish compared to Australian sporting leagues, they’ve long worked towards comparative financial balance for their teams. The NFL has a hard on-field salary cap, with extreme penalties for breaching it. Off-field, however, they believe that redistribution is a better idea than a strict cap on expenditure.
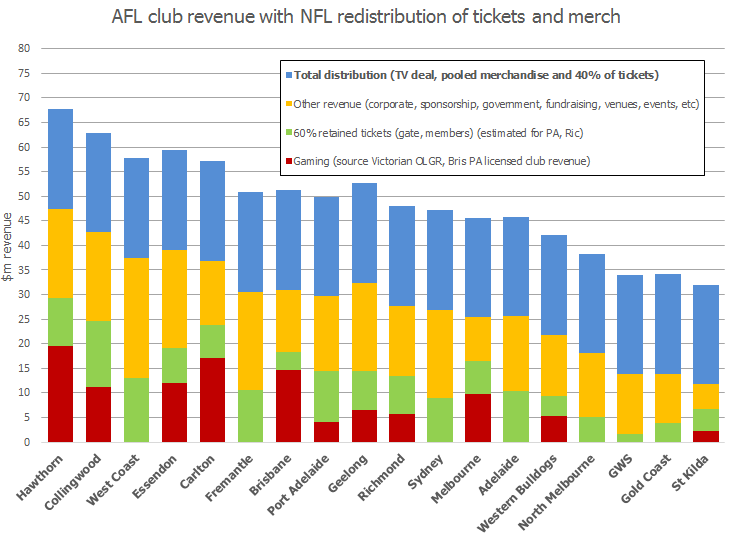
The NFL model sees all merchandise and 40% of all ticket revenue pooled together, and split equally between all teams, with each team retaining a 60% share of their own ticket revenue . Clubs can sell corporate box and “members club” type accesses and retain that revenue, but ticketing itself is subject to redistribution regardless of being season tickets or one-off tickets. Other revenue isn’t considered for redistribution, nor is gaming revenue a factor as it doesn’t really exist in US sport.
As a whole, this model provides a slightly more equal redistribution of funds than the AFL model. The clubs at the bottom end of the league, such as St Kilda, get a moderate boost whilst those high drawing teams, such as West Coast, take a bit of a hit. GWS and Gold Coast are notionally assigned an equal share and therefore lose ground due to their currently enlarged distribution. The biggest winners, surprisingly, are Essendon, Geelong and (especially) Carlton – clubs with stadium deal or size constraints which are currently not a big recipient of AFL funding.
For a similar model to effectively level the structural gaps between high and low revenue clubs in the AFL, gaming and other sources revenue would also have to be pulled in for redistribution.
Which brings us to…
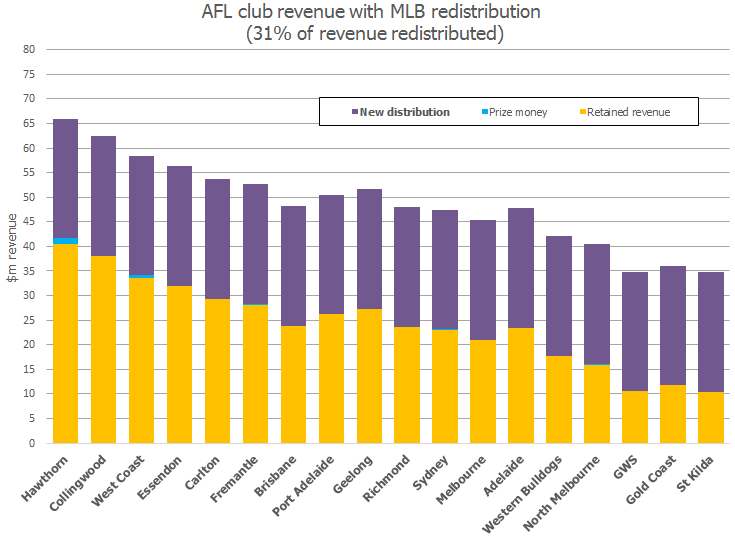
Major League Baseball has no hard salary cap. It has teams with massive spending and annual revenue, and others with minuscule budgets which call themselves “small market” and accept that they likely will never be powerhouses without a lot of luck or excellent management.
The MLB model is similar to the one alluded to above – a percentage of all revenue is redistributed among all teams equally. This scenario sees each team keep 69% of their revenue, and for 31% to be pooled together and split equally between the 18 teams.
The outcome is slightly fairer than the NFL model above, but still leaves some definite haves and have nots.
But what about a more unfair model that the current one?
The English Premier League has long been pilloried for having a Big Four and a significant gap to everyone else – a reputation that has taken somewhat of a hit after Leicester City’s title last year.
The modern EPL model still distributes more money to the popular successful teams, at the cost of those struggling to stay up in the top flight. It’s better than it was – Leicester’s success was built partly on a much better TV distribution than ever existed before. Their salaries were about 1/4th of the big boys which is much better than the 1/50th like occurs in Spain. In the long run the new arrangements will probably lead to more Cinderella stories in the EPL and we should never see championship odds of 5000:1 offered again. However the inequalities remain huge by Australian standards.
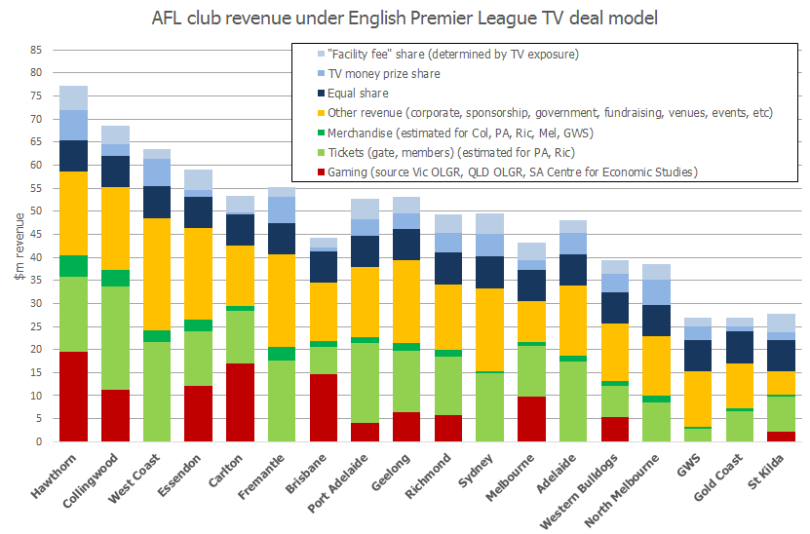
The model above shows teams getting distribution from the league based on two key items: finishing position in the previous season, and number of times broadcast on TV. This is how the rich get richer in the EPL, and the poor are left trying to keep up.
In the AFL the salary cap would largely mitigate much of the on-field disadvantage, but the comparative disadvantages off-field would be tremendous. The year-to-year revenue instability would cause havoc in football department spending.
We’ve used the prime TV free-to-air slots as shown in Melbourne as a rough analogue to the TV fee component. Off-broadway teams like GWS, Brisbane, Gold Coast and St Kilda get hammered under this model. West Coast and Fremantle do poorly in the TV stakes as well, as they’re generally only on Fox Footy in much of the country.
This model would really only work in an environment with a massive salary range, no salary caps, no draft, automatic free agency, and promotion and relegation.
Summing up
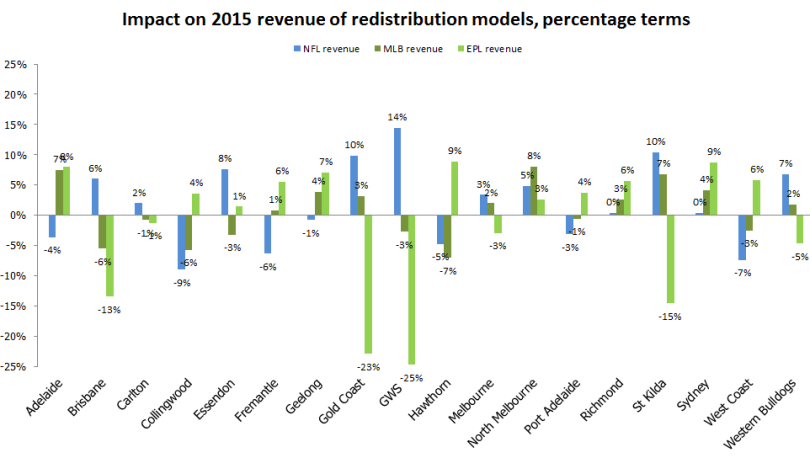
To summarise, then, below is the relative impact, for each club, of NFL-style partial revenue sharing, MLB all-in revenue sharing, and the EPL’s popularity and success-based approach:
Revenue-based financial equalisation could be used to more significantly reduce the gaps between the clubs with the highest and lowest revenues, and there are precedents in other salary cap and draft based leagues. Certainly, looking at revenue rather than expenditure would be a more effective took to actually achieve a degree of redistribution. It would also likely be much easier to administer than a spending cap.
The big jingly elephant in the room
Gaming machine revenue is a massive influence in Australian sport in a way that it isn’t in these aforementioned leagues. Poker machines are insanely prevalent in Australia and do huge social damage. This isn’t an opinion; it’s a fact. This post by Greg Jericho illustrates (using hard data) the nearly unique damage they do due to the speed and automated nature of play.
Below is what the AFL clubs’ revenue would look like if, over night, the governments of Victoria, Queensland, and South Australia had outlawed poker machines.
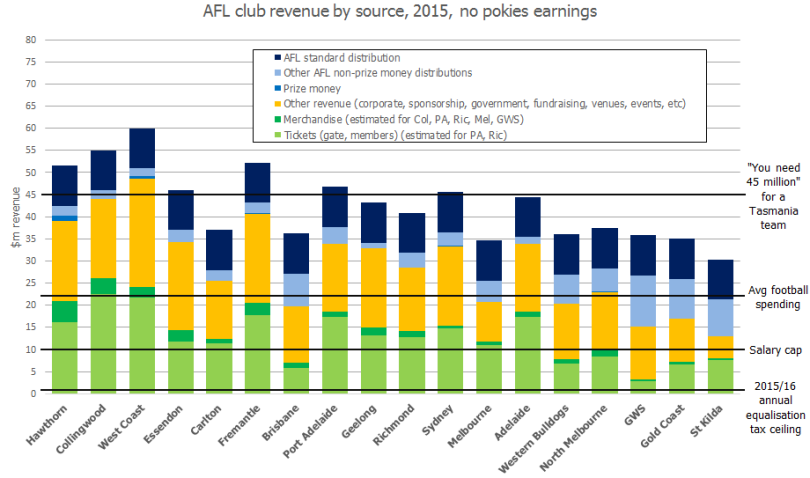
That’s $110m in gaming takings, from $876m in total club revenue. It’s a significant amount to be removing. Clubs argue that they have little choice but to rely on this money, and it’s not hard to see why. Below is our modelling of what each club’s profit and loss situation would look like if pokies were removed:
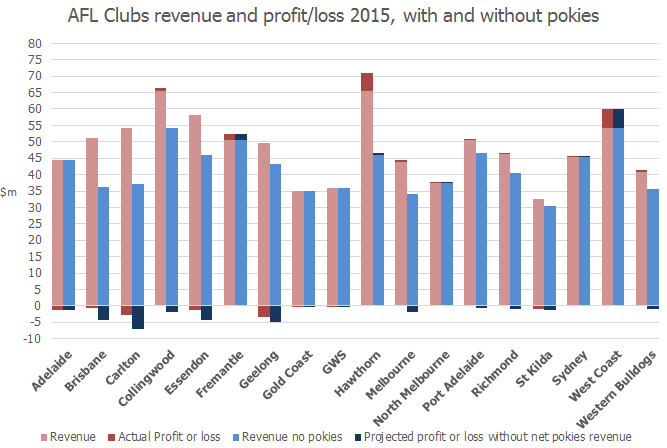
Based on the research we have done, we think that a generous assumption is that 25% of the revenue from pokies are extracted as profit. The rest of that revenue will of course go to maintaining the venues containing the pokies – to operating costs and to subsidised food and drink, and perhaps on other donations (including charitable ones).
Some clubs, such as Port Adelaide, barely make any profit on having poker machines after costs – South Australia does not permit any denomination of notes to be bet in poker machines, while Queensland permits $100 notes to be fed into the machines.
Some clubs, traditionally seen as battlers who are forced to rely on the machines, look like they’d actually be relatively okay without them. The 2015 reported profit of $400k at the Bulldogs becomes a $900k loss. That’s significant, but perhaps not crippling. Most importantly, the AFL could likely compensate for the short term loss with redistributed funds.
St Kilda only earn about $2m in gross revenue from pokies, so the modelled half-million deterioration in their net profit is nowhere near as big as some other clubs would face.
Other, more pokie revenue reliant, clubs (Carlton and Brisbane for example), look more heavily embedded. And Hawthorn, who made a $5m profit last year, look like they could divest from their $18m in gaming revenue fairly easily right now.
At least 40% of pokies losses are by problem gamblers according to the Productivity Commission. That means AFL clubs are presently benefiting to the tune of about $44m a year from people with gambling addictions.
Our point here is simply to show that pokies are a policy choice for each club, and that they have a benefit and a cost. Perhaps the AFL would be able to, with its ample revenues, navigate poorer clubs out of their dependence on this source of revenue. The new broadcast deal, bringing in potentially tens of millions of new distribution to AFL clubs, would seemingly provide the ideal opportunity to reshape the financial landscape for the better.
And ultimately this is the conclusion that HPN keeps arriving at – that a more equitable (but not even) distribution of funds would be one of the biggest drivers towards competitive equalisation, especially at a time which the AFL is receiving an influx of funds.