
As with previous years, we’ve taken a look at the AFL fixture in terms of how the lopsided match-ups impact on strength of schedule.
Here’s the summary:
- North Melbourne have the easiest fixture while GWS have the most difficult set of double-up opponents.
- The Bulldogs’ effort winning the premiership as 7th placed team has slightly upset the AFL’s grading of team strengths.
- Fremantle’s fixture is anomalously tough for a bottom side and the Saints can feel aggrieved from among the middle tier teams.
And some caveats:
- These are all based on several measures of strength of opponent, with no reference to factors such as breaks or home ground advantage.
- These assessments will inherently be different after the season has been played out – for example, Fremantle turned out to have the hardest fixture in 2016 after being projected to have a basically average one.
Strength of Schedule
Strength of schedule (SOS) is a method used in US sport to compare results in competitions with uneven fixtures. Our post on the 2016 fixture goes into more detail, so we will keep it brief here.
The NCAA use SOS to determine entry to Bowl games and the College Football Playoff, the NFL use it to break ties for determining draft order. It is essentially the win-loss ratio of a team’s set of opponents.
In the context of the AFL, where the fixture sees 18 teams play 22 games, which results in a slightly uneven draw. More specifically, it means that each team played 12 teams once and five teams twice. HPN can use SOS to assess the deviation of each team’s draw from a perfectly average opponent set. This table of numbers is sorted from hardest to easiest fixture (red is bad, green is good):
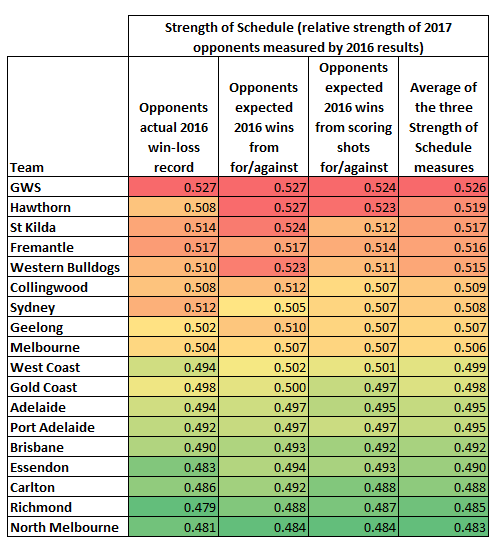
The table shows three measures of opponent strength. The first is just based on win-loss record.
The other two use more advanced methods to account for how teams “should” have performed. Those are Pythagorean expectations approaches pioneered by Bill James and here they’re based on points scored, and on scoring shots. Matter of Stats has a thorough explainer on the topic, but for our purposes it’s sufficient just to say that the two methods account for luck.
Points for/against accounts for the inherent luck in close games, and then scoring shot accuracy factors in the way accuracy tends to mostly (but not entirely, at least with Sydney’s defence) be based on luck and subject to reversion to the mean. We think adding these gives a more accurate picture of team strength.
We can also convert the above ratings to “games advantage” or a fixture effect on expected win-loss, as shown below, to give a more intuitive view of the degree of unevenness in a 22-game season: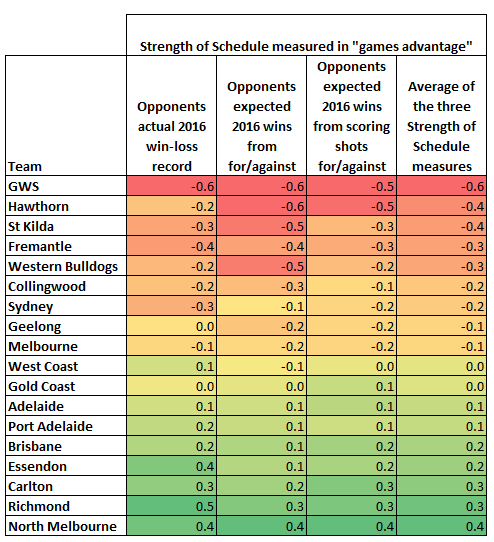
GWS faces the strongest set of return opponents while North Melbourne faces the easiest. Effectively, GWS’ draw puts them about 1 expected win behind North Melbourne compared to a completely even draw.
North Melbourne’s only “top 6” double-up is the Bulldogs, who of course actually finished 7th (and who were a bit lucky in close games to get to 15 wins) before their improbable premiership run. This leaves North with a very soft looking set of opponents for a middle-bracket side.
The impact of accounting for luck is visible in these calculations. Teams that had good luck in close games include Hawthorn, St Kilda and the Bulldogs; the three teams that the Swans play twice. This gives Sydney a much easier draw projected on Pythagorean expectations than on actual recorded win-loss records. Similarly, the Bulldogs play Sydney and GWS twice, both teams who are among those with the biggest gain in strength on those luck-based expectations.
To get a fuller picture, let’s now factor in 2016’s uneven fixture and add the two fixture-effects together, to see the cumulative impact for 2017:
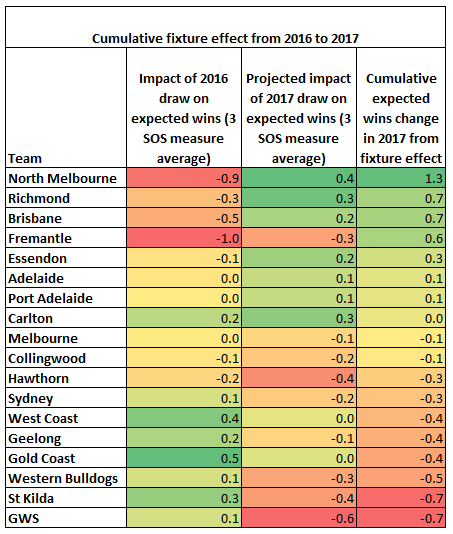
North Melbourne, who had a murderous fixture in 2016 and a much softer one in 2017, should be expected to be 1.3 wins better off just from the fixture effect. At the other end of the scale, the Saints and Giants look to be the worst off, both of whom move from below-average opponent strengths to above-average strengths.
How effectively did the AFL handicap in 2017?
The AFL’s goal in assigning double-up games is to handicap the fixture. The top 6 teams from last year play more top teams, and vice versa. This has the effect of giving top teams harder opponents and increasing competitiveness.
In a completely fair fixture where everyone played everyone else once (or twice), the only fixture effect would be not playing one’s own team. So the fact that top sides have a hard fixture despite not playing themselves signifies that the handicapping is working.
Here’s how the handicapping looks for 2017:
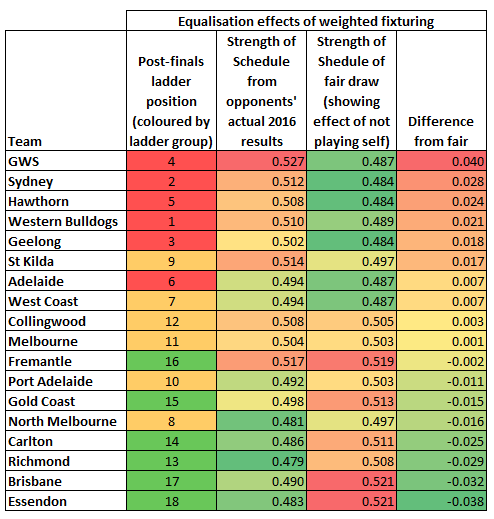
By deducting the “not playing self” effect, the top and bottom sides adjust their SOS ratings to some extent.
The biggest anomaly is Fremantle being handicapped harder than Port and North Melbourne, having been given almost a worst-case fixture within the bounds of the AFL’s policy. The Dockers drew the two strongest middle bracket teams (North and the Eagles), while many bottom sides get only one. They also get Richmond, the strongest bottom bracket side, and Geelong, one of the stronger top sides. This is nearly a worst case fixture – only replacing Essendon with a stronger bottom-6 side could make it tougher for them.
How did 2016 projections go?
How accurate will this all be? Last year we projected North Melbourne and Adelaide to have the toughest draws and St Kilda the easiest. Here’s how that fared:
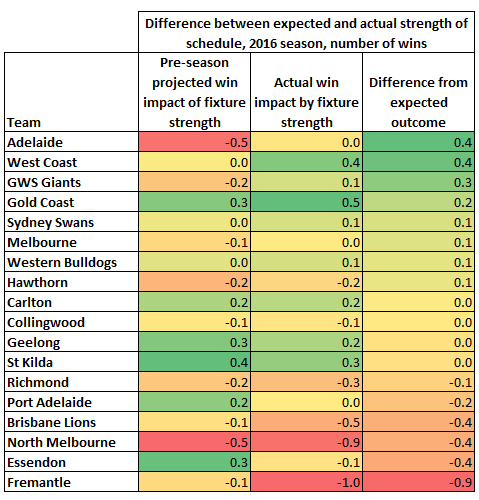
In actuality, North Melbourne’s draw got harder by virtue of the improvement in their double-up opponents Adelaide, St Kilda, the Bulldogs.
On the other hand, Adelaide’s opponents West Coast and Fremantle fell down the ladder, opening up their draw compared to initial expectations. Other teams such as West Coast and GWS also benefited from the decline of Fremantle.
At the other end, the improvement in the Giants and Crows made a number of fixtures harder than projected. Fremantle’s -0.9 expected win change from pre-season projections is due both to those two teams as well as their own collapse changing the “don’t play selves” component of schedule strength.
By design, projecting based on 2016 cannot predict the unexpected changes in strength and fortune that happen every year. Nobody can see the next Fremantle-style collapse or the next bolt up the ladder coming.
What we can say is that the AFL’s fixture handicapping continues to, mostly, do what it tries to do. It turns an uneven fixture, forced by the ugly task of dividing 17 opponents into 22 matches, into a tool for slightly improving competitive balance.