
Yesterday we took a look at the new structure for Super Rugby in 2016 and noted the fixture imbalances it throws up. We also looked at the 2015 format and noted that there are already fixture imbalances.
We calculated a “strength of schedule” measure, which is an indicator of the underlying strength of each team, absent 2015 draw effects. Today’s post will take that strength measure and apply it to the 2016 draw to analyse
A quick recap
Yesterday we noted that the 2016 season:
- Creates symmetry in each conference’s external opponents where previously external fixtures were unbalanced, but;
- Leaves Australian and New Zealand teams with an internally uneven fixture as they play two teams in their own conference twice and two teams once.
- Causes the additional travel burden to fall mostly on the African teams as well as unavoidably falling most heavily on the Jaguares and Sunwolves.
- Leaves each conference entirely avoiding one half of the other continent (ie, Africa 1 does not play NZ teams)
- By preserving intra-country conferences, continues the situation where New Zealand teams face a harder schedule than everyone else due to the strength of their local opponents
We then took a look at the 2015 fixture, already uneven, and noted the impacts the draw had on final standings, especially in that it allowed the Brumbies to qualify at the expense of the stronger Crusaders. We calculated a strength of schedule for each team as shown below:
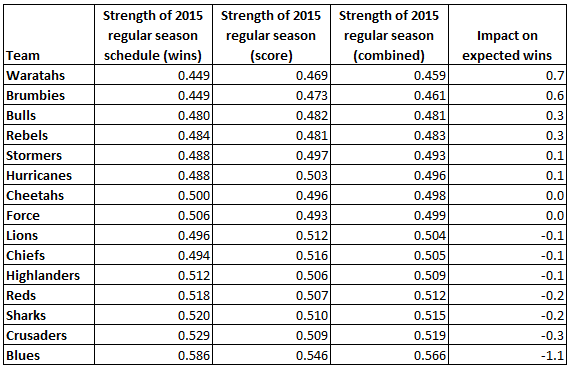
This Strength of Schedule rating will form the basis of our analysis of the 2016 draw, but first we need to take a look at the three new teams.
The Newcomers
The entry of new teams presents a challenge for strength of schedule ratings. With little alternative, we have applied the lines from the Sportsbet total win markets to assign them an assumed strength.
The Jaguares look to be clearly the most formidable new side and a rating of 9 wins based on the betting markets makes them contenders am in their pool (ahead of the Lions and Sharks and way ahead of the hapless Kings).
An indicator of their strength is that the Jaguares have assembled most of the Argentinian national side (the Pumas) save for several of their big guns. The Jaguares are the sort of team Argentina might field in a tour game or World Cup group game against Namibia. Big outs relative to the semifinalist World Cup Pumas squad are:
- Juan Imhoff (scored 5 tries in the World Cup), Juan Martín Fernández Lobbe (played every game, started 6 of 7) and Juan Pablo Orlandi (played 4 WC games, scored a try) who will remain in France.
- Marcos Ayerza and Horacio Agulla (1 world cup try) who will remain in England.
- Tomás Cubelli (played every game, scored 2 tries) who is headed to the Brumbies.
Three of these guys (Lobbe, Orlandi and Ayerza) are 32 or 33 years old and so may be near the end of their careers anyway.
We count 28 players with international experience at the Jaguares, which is well up on most other sides. Despite the absence of a few of their leading tryscorers at international level, not to mention the other core players missing from the 2015 RWC run, their inaugural starting XV will contain 11 (!) players from the semi final. There’s also another 3 RWC semi finalists on the bench, which no other team can boast going into this week.
For comparison, the current All Blacks squad breaks down into nine Crusaders, seven Hurricanes and five Chiefs among others, although the Chiefs also have eight former All Blacks. The Waratahs boast ten current Wallabies (14 total) and the Brumbies nine (12 total). The Bulls have the most current Springboks with seven, although they have another seven former internationals.
Essentially, the Jaguares have around twice as many internationally experienced players as any other team, and they have an edge in recent or current international players as well. That makes them look pretty formidable even if the Pumas are not as strong as the All Blacks or Springboks or Wallabies. Working against them will be the inbuilt permanent and heavy travel load. If they can manage to adjust, they look very strong.
The Sunwolves are a far more motley crew than the Jaguares, with plucky Tier 2 Japan simply not having the national strength of Argentina. We’ve rated them a 2-win team based on the betting markets, and they look very brittle based on squad composition, but they’re also the biggest unknown.
This is what we have gathered to be the composition of the Sunwolves squad:
- 11 players from Japan’s 2015 World Cup campaign
- 4 other internationally-capped Japan players
- 1 tier one foreign international (Tomás Leonardi – Argentina)
- 3 tier two foreign internationals (Fa’atiga Lemalu and Tusi Pisi from Samoa and Andrew Derutalo from the USA)
- 4 players with experience in Japan’s U20 side, all previously playing for universities
- 3 Super Rugby experienced players (Ed Quirk – Reds, Liaki Moli – Blues, Riaan Viljoen – Sharks)
- 13 players with top level domestic rugby experience in the Japanese Top Rugby or elsewhere such as New Zealand’s provincial competition
The side has had little preparation having been pulled together late, and has only been training together for a short while. Compared to the Jaguares the Sunwolves have less of their nation’s talent pool accumulated in their side. There are seven other Japanese national players dispersed around other Super Rugby teams and two are instead playing in England.
Interestingly, from the Japanese national squad, 12 players are still playing domestic rugby in Japan. This includes nine who played in the World Cup. The group of domestically-signed rather than Sunwolves-signed Japanese internationals includes two World Cup tryscorers who aren’t even playing at the top level in Japan (Karne Hesketh is at second tier Munakata Sanix Blues and Yoshikazu Fujita is at Waseda University).
It’s unclear whether the Sunwolves were unable to secure more Japanese national players in the short window they had, or if they chose not to sign them. We suspect the former and that the Sunwolves have faced a battle with Top Rugby sides to secure the best Japanese league talent.
In terms of their impressive World Cup team’s scoring power, the Japanese cult hero and main goal kicker Ayumi Goromaru instead signed with the Reds. The Sunwolves are also missing the scorers of seven of Japan’s eight World Cup tries.
There are plenty of experienced internationals at the Sunwolves – 18 in all – but only one from a tier one nation. We don’t expect much from them this year, but with more time and preparation, and if they can lure more Japanese internationals in future, perhaps there’s a path to improvement for them in subsequent seasons.
The Kings will just be terrible. We have them as a two win side per the bookies’ projections but even this may be optimistic given sides have gone winless before in Super Rugby. They are essentially a bad provincial South African rugby side.
The Eastern Province Kings, largely the same team as the Super Rugby side, finished 7th in the Currie Cup last year. Of eight teams. They managed to win two games, and were only able to muster up 23 tries across their 10 games. In the previous Currie Cup, they finished with just one win, anchored to the bottom of the table. They were saved from relegation due to their forthcoming entry to the Super Rugby competition, and the fact that they were an “anchor” team in South Africa.
As far as we can tell they don’t have a single Springbok (past or present), they’ve managed to bring in three players from other Super Rugby sides, two South Africans from France, and another five players from provincial sides other than the Eastern Province Kings. As recently as November they weren’t paying players on time. They’ve also been “taken over” by the SARU from an administrative standpoint. Things are not looking bright for the Kings right now.
Evaluating the 2016 fixture
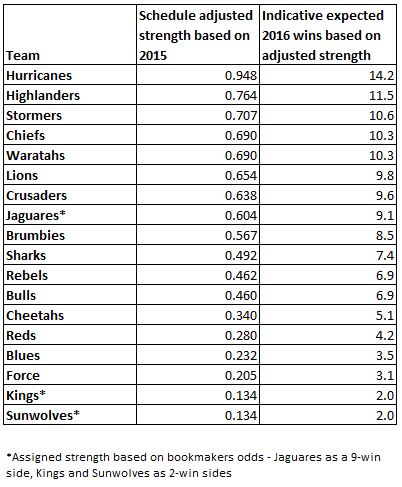
Having established the Jaguares, Sunwolves and Kings as nine, two and two win teams in terms of assumed strength, we can slot them into our schedule adjusted strength ratings. The results are as follows (some rounding to get the overall competition to 0.500 has been applied):
We can then use this indicative strength to assess the draw for each team. Let’s start by looking at overall conference strength, since which conference is matched with which has a significant influence over draw difficulty:
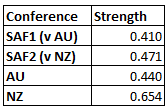
This clearly indicates that SANZA(A)R have handicapped their pairings in year one by placing the stronger of each half of the teams against each other.
The New Zealand sides, who collectively project to win 65% of their matches in a fair draw, match up with the stronger (47%) part of Africa, including the Lions, Jaguares and Sharks (and the Kings). The weaker African half (Sunwolves, Stormers, Cheetahs and Bulls), who rate a 41% winning record under a fair draw, get away with a matchup against the 44% Australians.
Put another way, selection of African conference opponents makes a 6% (0.9 win) difference between the Australiasian conferences. But going the other way, the benefit to the African conference of getting Australian opponents over New Zealand opponents is 21%, a full 3.2 win head start.
We can also quantify the internal disparities within each Australasian conference. Below is a chart of who plays double-up games against who (this isn’t an issue in Africa as the intra-conference draw is symmetrical.
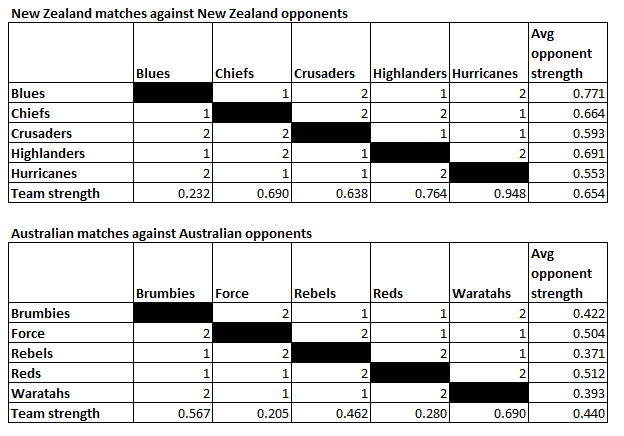
In New Zealand the Blues have been given the toughest draw through the inescapably bad luck of not getting to play themselves. The hardest possible drawset would be the Highlanders and Hurricanes twice, and nobody cops that double. On the flipside the Crusaders have, by New Zealand standards, a kind draw, avoiding a second match against either of those two toughest teams. The difference between the Crusaders’ draw and the Highlanders’ is about 0.6 expected wins over the season.
In Australia, the Rebels have been handed the easiest possible draw by playing the Force and Reds twice and the Brumbies and Waratahs once. Like the New Zealand conference, nobody cops the toughest double-up of the Waratahs and Brumbies. The Reds come the closest by playing the Waratahs and Rebels twice – the hardest and third-hardest opponents. The difference between the Rebels’ and Force’s opponents is about 0.8 expected wins over the season.
Projecting 2016
Let’s now apply these strengths at the projected results. Remember that the only information feeding into this is 2015 results and an estimated strength for the three new teams:
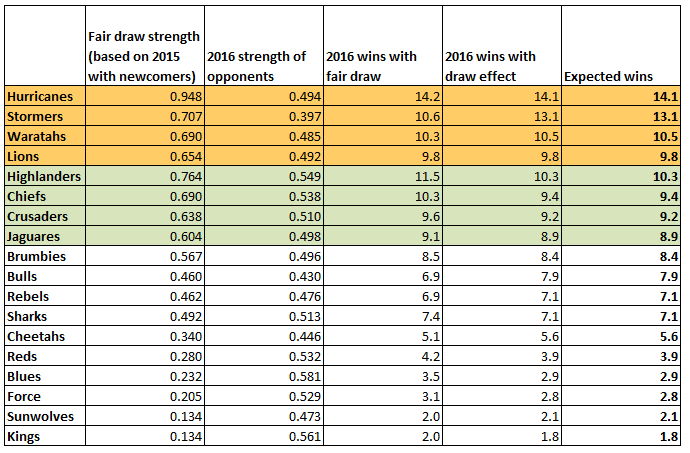
On last year’s results, with this year’s draw, we get four of five New Zealand teams qualifying for the finals in spite of draw difficulty, by claiming all three wildcards. This is because compared to last year the Kiwis face less points cannibalism due to more games outside their conference. The Brumbies, facing a tougher draw than last year, get pipped for the third Australasian wildcard by the Crusaders by about 0.6 wins.
In the African side, the Stormers romp to second seed on a very easy New Zealand free schedule, while the Lions win the other conference win leaving the Jaguares to collect the African wildcard entry. The Jaguares, notably, manage this despite being in the tougher group with a lot of New Zealand opponents.
Factoring in luck
When we discussed the 2016 AFL fixture we looked both at what did happen and what might be expected to happen based on probability. One of the variables we looked at was close game luck. Over time, teams tend to lose as many close matches as they win so if they did unusually well one year, that tends to normalise over time and so close game luck can be used to suggest which teams might rise or fall in the standings.
In the case of the 2015 Super Rugby season, here’s what happened in games decided by a single score (7 points or less, excluding the Lions-Stormers draw):
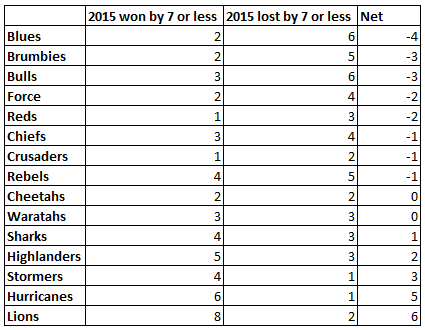
If luck were to revert to the mean in 2016 and close games were to break even, the Lions would suffer the biggest results slump (winning 3 less) followed by the Hurricanes (2.5 less) and Stormers (1.5 less). The Blues on the other hand would win 2 more games and the Brumbies and Bulls 1.5 more games.
If we insert this normalised luck effect (also adjusting for the season being 15 instead of 16 games long), our updated ladder projections look like this:
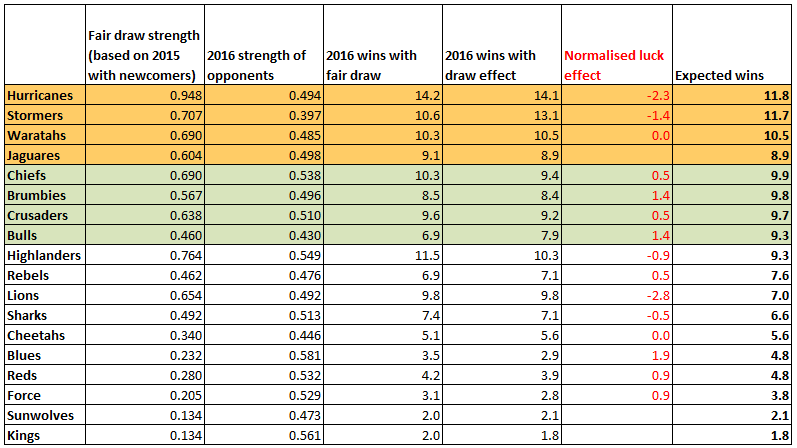
Correcting for their very good run in close games last season, the Hurricanes crash back to, uh, still winning top spot… but lose more than a single game. The Brumbies turning their luck around gets them into the finals as a wildcard at the expense of the Highlanders.
In Africa the significant regression of the Lions leaves the Jaguares to claim their seeded spot, and the Bulls even manage to claim the wildcard on the back of their softer draw.
Conclusion
Remember that the only three things we’ve changed from 2015 in the final projection above is:
- inserting the new teams with a betting market based strength assumption
- adjusted for the strength of schedule for each team in 2016 versus the 2015 schedule
- normalised for luck, assuming each team breaks even in close games rather than achieving the close game split they did in 2015
This of course means we won’t be correct. Teams change personnel, have new injuries, luck breaks differently, tactics are adjusted, and so forth. All we can do is model the future based on insights from the past and be clear that all models are wrong but some models are useful.
We think this model is quite useful in that it shows us the impact of the draw on teams, but also that in the end, close game luck has just as big a role to play. The draw sets conditions, but the draw is not destiny.
We also want to note that while our modelling here illustrates the imbalance inherent in this Super Rugby structure, but this isn’t even really intended to be strong criticism. The tournament is what it is, it’s been designed this way because stakeholders feel that complete draw symmetry is less important to them than other factors like season length, minimising travel and maxmising fan interest. That’s a valid position to take.
There’s changes that could be made but they would all change one of the parameters currently constraining things – we could increase travel loads and reduce fan interest to achieve draw symmetry for instance. we could lengthen the season to achieve it. We could add more teams. We suspect the tournament will continue to evolve as time goes on.