
The 12 days of HPNXmas is our way of giving back over the holiday period, and providing a place for some of our thoughts that didn’t get run for whatever reason during the year.
We made a lot of graphics this year. Some of them we were quite pleased with. Here’s some of them:
Defensive pressure visualised
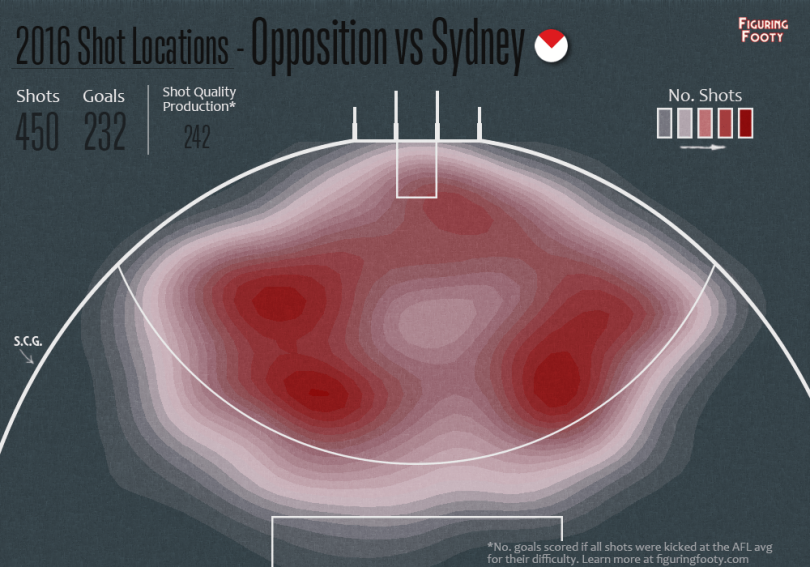
We guest posted at Figuring Footy to preview the Geelong v Sydney preliminary final and Rob produced for the post this graphic, showing Sydney’s inside-50 defensive prowess, something that ended up predicting the game’s outcome quite well.
Trade period resource balances
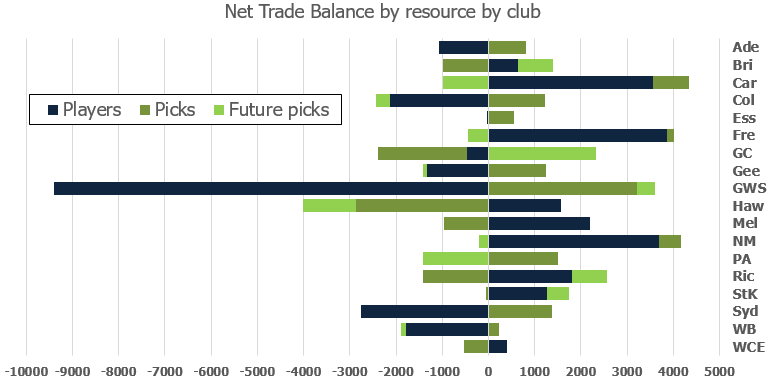
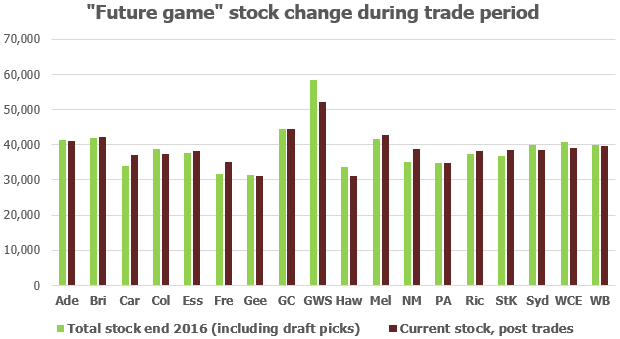
These two were from our summary of the Winners and Losers of the trade period, showing how the resources of each team had changed hands, illustrating quite clearly the loss-making trades GWS were making with their massive glut of highly coveted but fringe players:
A little bit of perfection
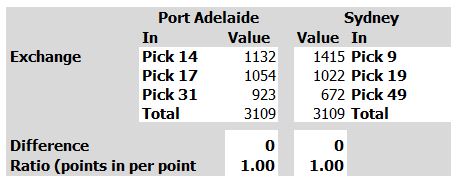
Among every trade that happened was a sneaky little (as rated by us) perfectly balanced pick swap:
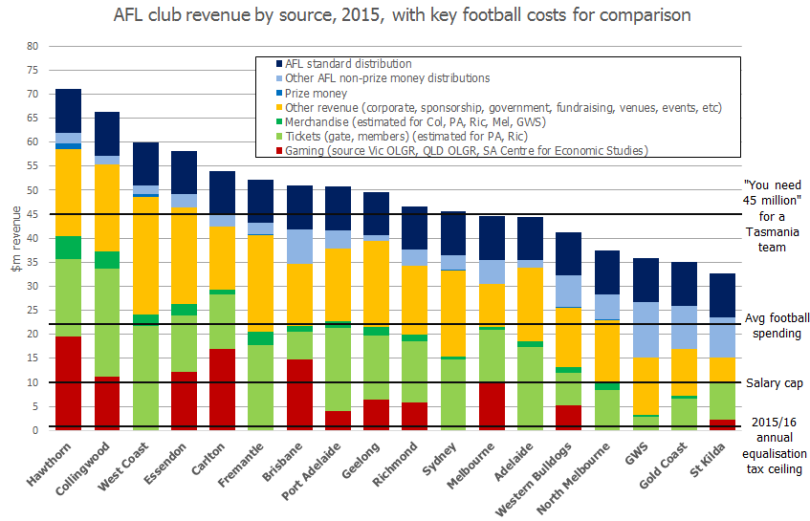
AFL club revenue
Our most popular post this year was a look at AFL club revenue by source, seemingly circulated a lot with reference to the pokies usage of different clubs (note that this is revenue, not profit. The post contained other data on profit and asset bases).
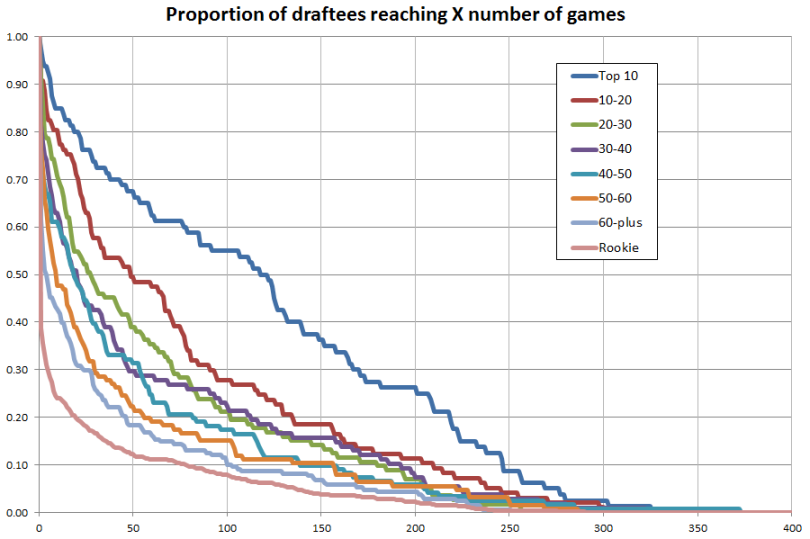
Draftee survival functions
Cribbing an idea from Soccermetrics, at their suggestion, an MLS blogger, we charted the “survival rate” of draftees to different numbers of games.
And that’s it for the year. Stay tuned tomorrow for when, through the bleary eyes of New Year, we look back at our worst calls of 2016.