
This is HPN’s third year of providing predictions on the ladder for the upcoming AFL season. Some things have changed with our methods, but most haven’t. As we explained last year:
“Like last season’s prediction, this projection shouldn’t be used as exact gospel on how a team should perform in 2016, but more of a general indicator on whether they should improve or decline compared with last season. The method deliberately constrains itself to a few measurable thing and, most notably, entirely omits new recruits and departures from consideration.”
That holds true for this year as well. As does this:
“The method relies more on the simple than the statistically complex, however it did a reasonable job at predicting the movement of teams last season (with a few notable exceptions). After last year’s results, we’ve made a few tweaks to the formula that we hope will increase the accuracy.”
In 2017, we are adding a second measure of team strength – but I’ll get to that more later.
Like last year, both methods are reliant on three key elements:
- Strength of team
- Strength of schedule
- Relative age effect
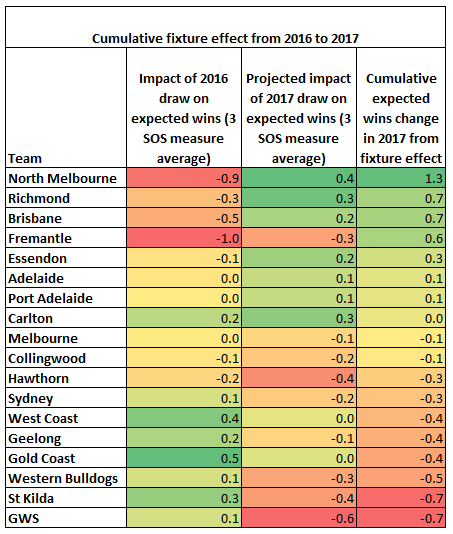
HPN has already had a look at the predicted strength of schedule for the 2017 season here, but here’s our final findings from that article if you want to save a click:
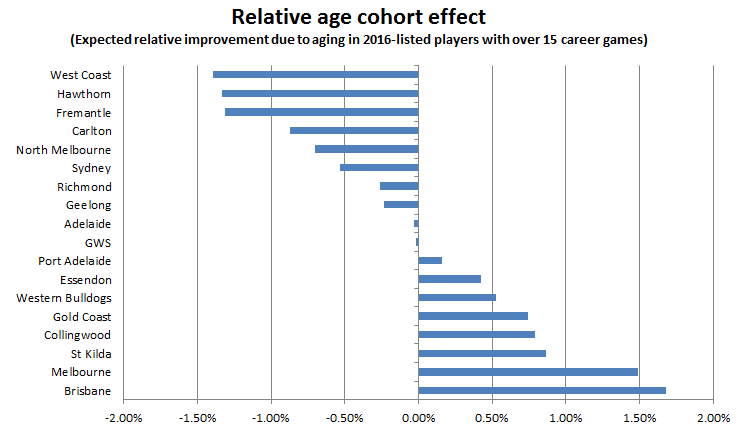
The relative age effect was described last year here, but in short HPN projects an output curve to all players on each list with 15 career games under their belt and who were at the club last year, to measure the expected improvement from a pure “cohort ageing effect” in their continuing players. Below is a chart of that age effect in relative terms, for each team in the league:
The season age effect is calculated in this manner:
Season Age Effect = (Number of players on senior list ^ (1 + Relative Age Effect)) – Number of players on senior list
While this may not be the most accurate calculation, or one that accounts for each player’s particular career arcs, it did a pretty good job last year and has merit on face value. As indicated above, Brisbane, Melbourne, St Kilda and Collingwood have the most rapidly maturing lists, and all are generally thought to be on the path up the ladder in 2017. At the other side of the equation, West Coast moved firmly into win-now mode, and Hawthorn undertook a list regeneration over the offseason. Both moves hurt the age profile of their experienced players.
Also of note is the number of players that each side has gained or lost with at least 15 games of experience (however this does not feed into the formula):
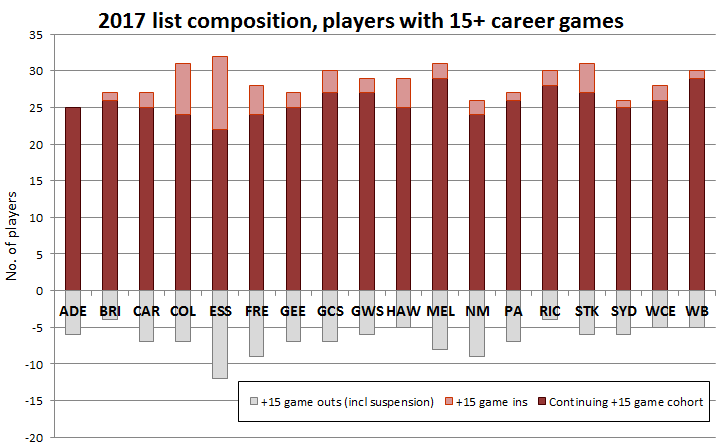
You can see that Essendon, for the second year running, have had the biggest turn-over of players with more than 15 games played (for well stated reasons). Fremantle and North both lost nine experienced players.
It is the final measure of the three above that has undergone the most significant change in 2017.
Strength of team
In the past we have used the Pythagorean Expectation to calculate a team’s true strength, as we have outlined before. The Pythagorean Expectation looks at how a team “should have” performed in a season, by using points for-against to project wins. This should, in a perfect world, account for a team’s luck in close games, which we have theorised previously is basically random. This method is the basis of the previous “solid results”.
This year we have decided to measure team strength in a second way, by using the team strength measures developed last year by HPN. We outline the three measures here, but basically the measure we are using is overall team strength. We are entirely unsure how this will go; but we thought we’d throw caution to the wind and give it a look anyway. HPN has also included the bookies markets for wins over/under as a benchmark of public opinion, and a rough % of the likelihood of making finals (calculated via a normal distribution).
Pythagorean Expectation Method
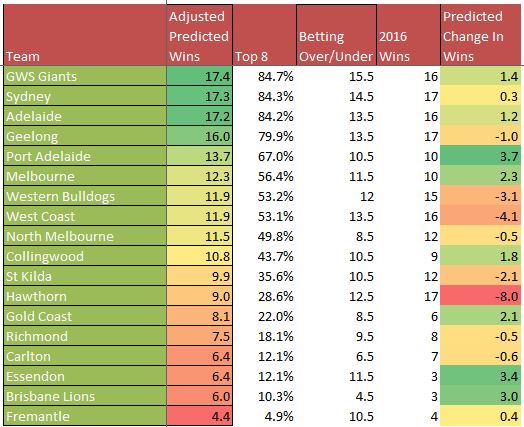
This method sees Hawthorn sliding massively, due to a list aging in the wrong way, a slightly harder than average draw and a lot of luck in 2016. Hawthorn won all of their six games decided by less than two goals; something the Pythagorean Expectation doesn’t take kindly too. Whilst they won 17 games last year, they played more like a 11 win team – something potentially explaining their swift exit from the finals.
The Dogs were also very lucky in close games, and face one of the three hardest draws in 2017. West Coast suffers from all three of the aforementioned factors: four wins from five close games, a big hit from the age effect, and a tougher than normal draw. Finally, the Saints face the equal toughest 2017 slate, and take a hit from the Pythagorean Expectation.
On the flip side, Port Adelaide (HPN’s perennial prediction bogey side) have a list that is slowly coming into its prime, a somewhat soft draw and horrendous luck in close games last year. In short, they should improve on their showing last year, especially with Ryder and Monfries coming in – but this is the third straight year we have said this. Melbourne, Gold Coast, Collingwood and Brisbane’s improvement is nearly entirely explained by the maturation of its list, whilst Essendon’s gains are largely from the Pythagorean Expectation refusing to believe that they are really that bad.
North Melbourne stays relatively stable due to its cakewalk fixture – the method doesn’t know about the exodus of experienced players.
HPN Ratings Method
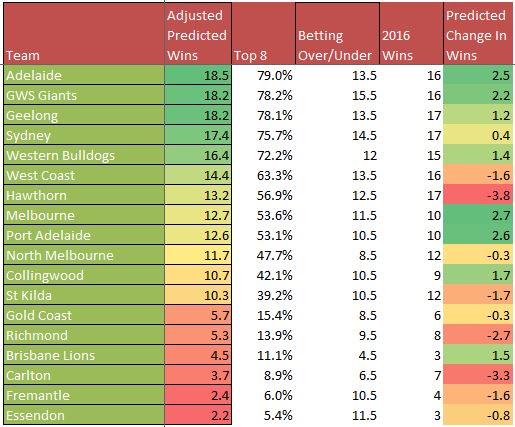
The HPN Ratings is another (attempted) measure of actual strength, and one that differs somewhat from the Pythagorean Expectation strength as above. We applied the same age and draw effects to the strength, so that there is continuity for those elements.
Port Adelaide narrowly drops out of the predicted finals at the expense of Hawthorn – but the differences between the middle six teams is quite small. The HPN Ratings method suggests that there is a massive gap between the middle and lower tiers of the ladder – something that is unlikely to happen in real life.
The HPN Ratings are ignorant of the return of the suspended Essendon players, and suggests that they will struggle in 2017. Carlton sees a massive dip, as a side both aging and rebuilding at the same time. The HPN Ratings are bullish that the top five teams will pull away from the pack, and that Adelaide will negotiate a season that will likely be more injury interrupted than the past few. Hawthorn still struggles here, but less than with the PE, and almost in line with the bookie predictions.
Which Method Is Better?
If you’ve read this far, I’m sure you’d want to know which method we think will perform better. At this stage, we have no idea – but the Pythagorean Expectation should be more predictive in nature. HPN expects the Ratings to do pretty well, but there’s is no way to tell until the games are actually played. One thing that both methods suggest is that the race for the finals, and the top four, is wide open going into the season.