
As the bye rounds get underway, our ratings system based on forward, defensive and midfield strength continues to settle into seeing a top three teams and then a large middle class.
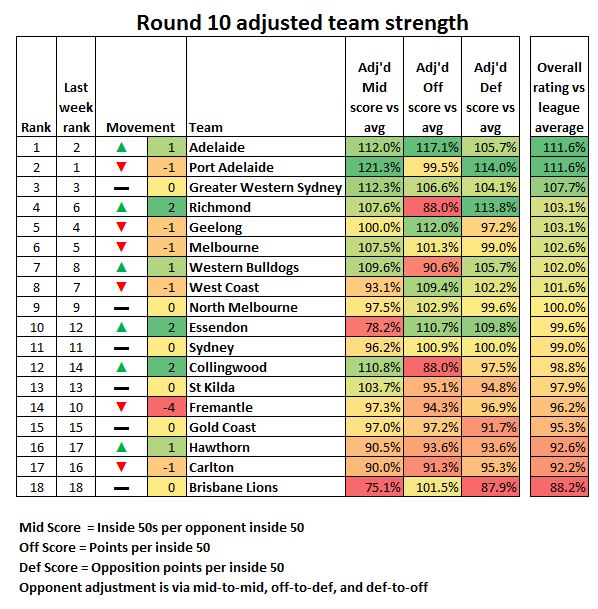 Alongside the ladder’s top two of Adelaide and GWS we also see Port Adelaide defying their eighth ladder position by sitting second overall in strength rating. The most obvious point here is they’re a game behind everyone else – win that (by enacting revenge on The Bye, perhaps) and they’re 4th.
We’ve talked before about Port’s midfield and defensive strength, this week we want to focus on the widespread analytical unanimity regarding them. Our high rating is interesting because we’ve come up with a similarly high rating of Port Adelaide to a number of other amateur analysts taking different approaches. The Arc has them 4th in its Elo system, Footymaths has them 3rd, Troy Wheatley’s power rankings has them third. Adrian Polykandrites has them 3rd in a subjective power ranking. Tony Corke has them with the second highest expected win percentage.
Why the agreement? Port have mostly done two things this year – destroyed lowly sides by extravagant margins, and put in competitive losing efforts against other contenders.
Their worst performance of the year, the loss to West Coast, still looks pretty good from most non-score based metrics and was probably best seen as a confounding tactical win for the Eagles rather than a lasting indictment on Port’s quality. Other than that, the Ls have been respectable losses to the top two sides and almost rolling Geelong on their absurd home deck.
The interesting thing, though, is the footy world doesn’t yet have much a track record for Port against teams in the vast middle tier of either the ladder or strength rankings. They have beaten the four current bottom sides and a 7th-placed Fremantle with a giant asterisk hovering over them. They’ve lost to the top three sides and then to 6th-placed West Coast in a truly weird game.
The Eagles and Dockers are the only teams they’ve played who are sitting anywhere between top-4 lock and likely non-finalist. Can Port lock up the expected wins against the league’s middle class? All our analytical signs, and those of others, seem to point to “yes”, but it really remains to be seen.
This week, it’s all downside for them – anything other than a big win over a 2017 struggler in Hawthorn will downgrade their ratings, and another dominant effort would just be more of the same. Fixtures can be weird that way.
Plotting the team strengths
The table of strength ratings we show above can also be presented in a graphical format, combining any two of the strengths to characterise the teams in different dimensions. Below are several charts plotting teams relative to the league average. In each case, you want your team to be in the top right quadrant.
A general bit of context: Most premiership teams sit in the top right quadrant (ie, above average on all measures), mostly above 105% on each. The main exceptions have been the 2016 Bulldogs and the 2005 Swans who both had slightly below average offensive strength.
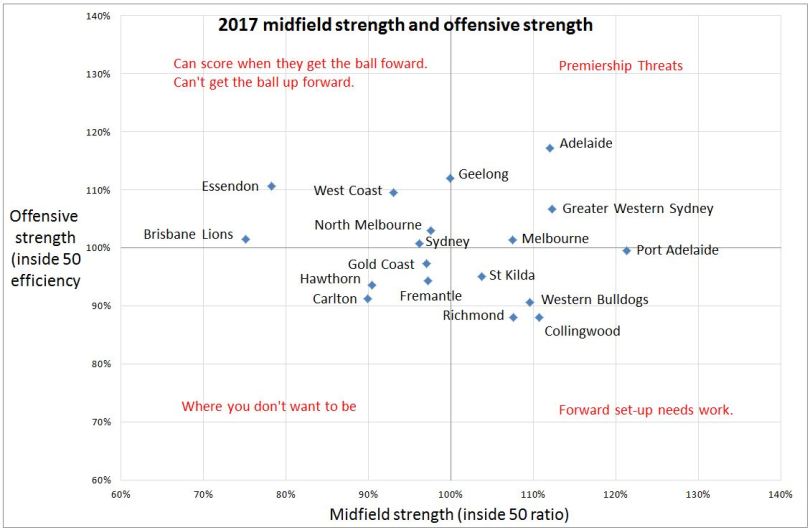
Adelaide and GWS are the main powerhouses in the midfield+forward dimension. They both generate a predominance of inside-50s, and then use them with above average efficiency once inside. A number of sides such as the Bulldogs, Collingwood and Richmond clearly show their main flaw on this graph – butchering their plentiful inside-50 forays.
Brisbane are highlighted here as being non-terrible once they actually get forward. Zorko, Hipwood, Robinson, Beams and Schache have all averaged a goal a game when they’ve played and collectively done enough to pose an average level of forward threat.
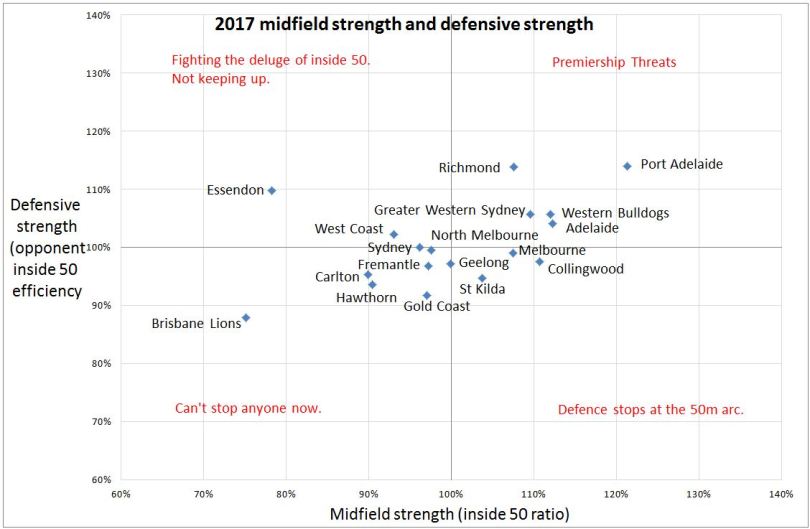
There’s Port Adelaide, using the combination of inside-50 predominance and a stingy defence on the relatively rate occasions they concede as their main path to victory. Richmond look the same but to a lesser extent. Essendon are highlighted as a team which defends pretty well – and they have to, as their midfield is providing no assistance. Brisbane are Brisbane.
The other fourteen teams seem to cluster rather tightly here, in stark contrast to 2016 when Sydney were historically good defensively decent on the midfield axis, with more sides trailimh off towards current Brisbane territory of defending poorly but getting hammered even worse between the arcs.
Within the cluster, West Coast stand out as a team who look poor in the midfield and average in defense, but in spite of these measures but are still firmly in finalist range.
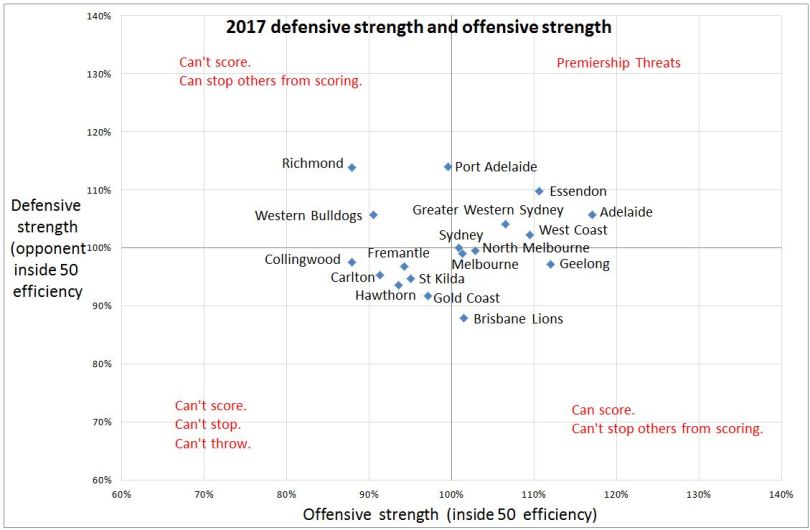
This third plot ignores the midfield and just focuses on what happens within the 50-metre arcs. Teams that look really strong at both ends of the ground are Essendon and Adelaide and to a lesser extent, GWS and West Coast. The key difference between the four sides is of course how well their midfield power protects and provides opportunity at the two ends.
Note that “midfield” here refers to everything between the arcs – midfield strength by inside-50 is a measure of the whole team’s power between the arcs. Adelaide and GWS’ much vaunted half backs contribute to the midfield just as much as the “true” midfields.
At the other side of the line, we see a stack of sides who look below average at both ends of the park. Collingwood, Carlton, Fremantle, St Kilda, Hawthorn and Gold Coast all, relatively speaking, leave a lot of work to be done by players in the middle of the field.
Finally, Richmond and the Bulldogs almost stand alone as being effective in defence and pretty dysfunctional up forward.