
This year we’ve been trialling a fairly simple method of rating team strength based on statistics derived from inside 50s, which correlate strongly with winning teams. The premier usually sits near the top of the pile in these measures, as we’ll see later in this post.
The ratings are three simple statistical ratios:
- Midfield Score (inside 50 ratio)
- Offence score (efficiency of inside 50 conversions)
- Defensive score (inverted efficiency of opponent inside 50 conversions)
These measures are then adjusted for opposition strength and converted to a percentage relative to the league average, which are presented in these charts:
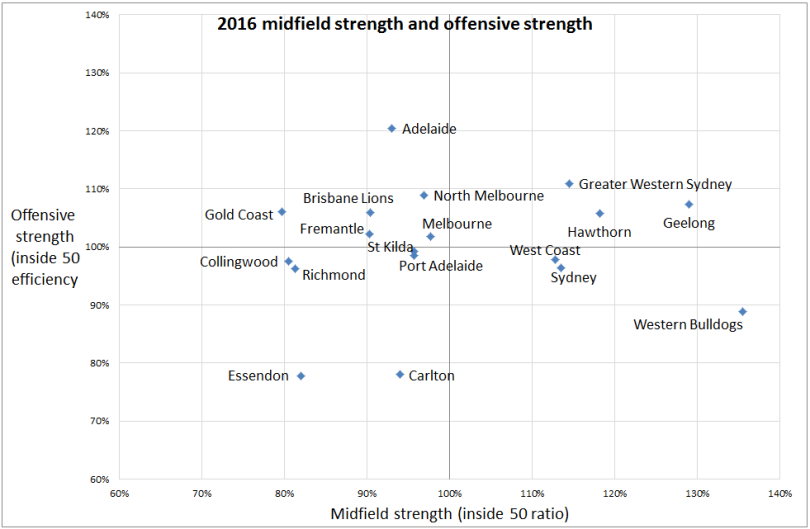
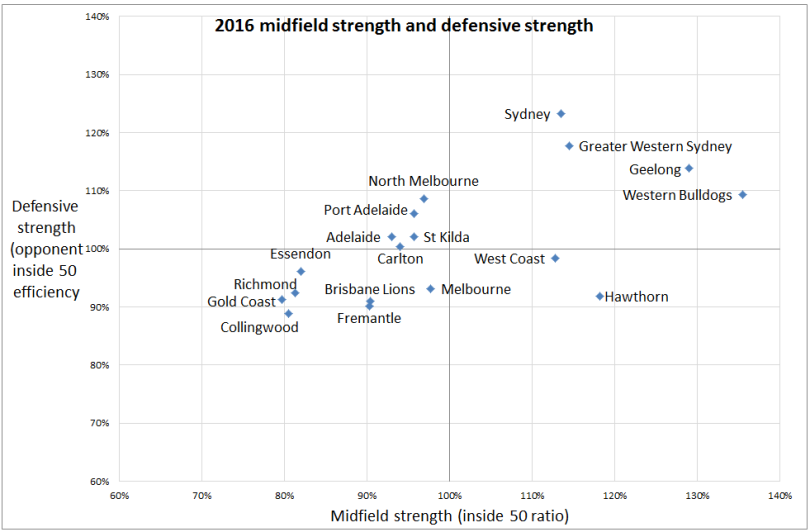

These charts show that Geelong and GWS are the only teams who are above average in all three of our measures and rate as the strongest sides across the season so far.
A number of other contenders seem to have one main shortcoming this season. Sydney and the Bulldogs show as below the league average on forward efficiency and therefore succeeding through defence and through volume of inside 50 opportunities. Hawthorn show as lacking in defence, rating quite lowly in terms of their ability to defend against inside 50s once they occur. Adelaide and North Melbourne rate as below average in the midfield, apparnetly compensating for lower inside 50 counts by using them very efficiently.
Club showing as above average in just a single measure include West Coast (midfield strength), Port Adelaide, St Kilda and Carlton (defensive strength) and Melbourne, Brisbane, Fremantle and Gold Coast (forward strength). The remaining sides in Collingwood, Richmond and Essendon appear as below the league average across all of these measures.
If we compare these to historical data, we can see the fairly strong correlation between these three inside-50 based measures and premiership success:
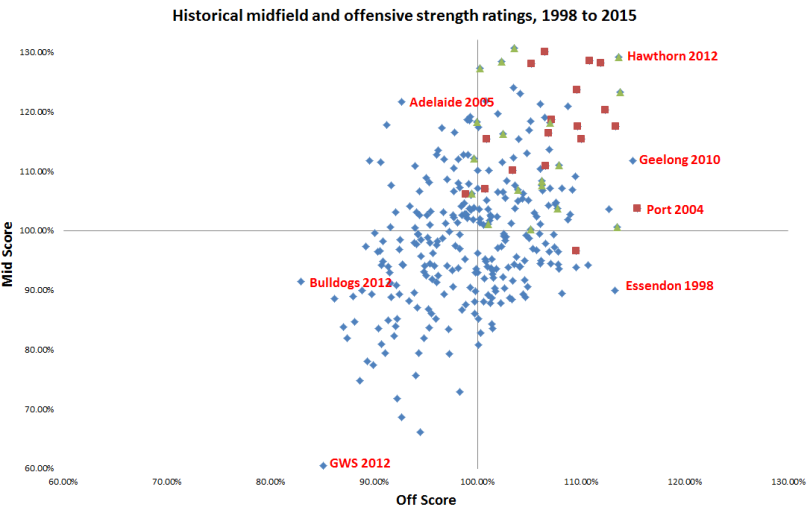
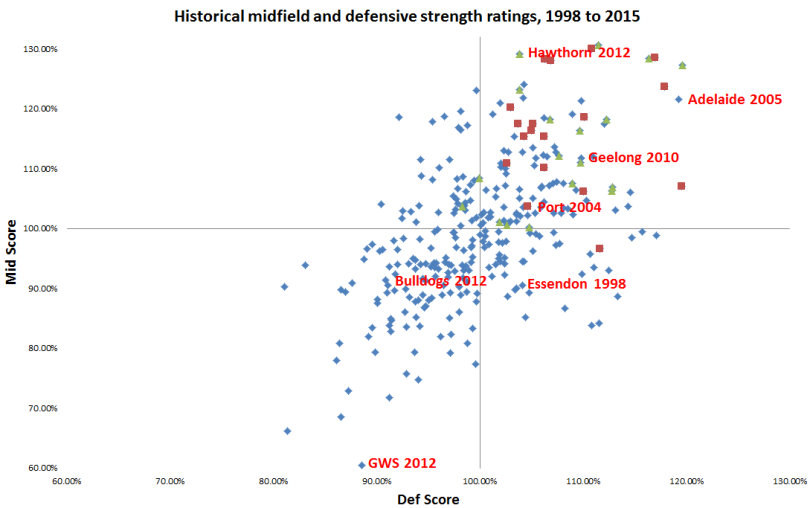
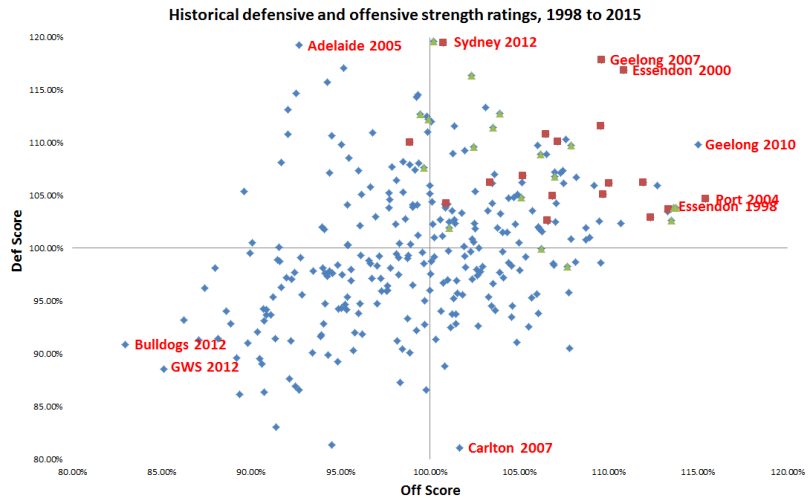
Every premier since 1998 had an above average midfield strength (inside 50 ratio) except North Melbourne 1999, while only Sydney in 2005 were below average in offensive strength (scores per inside 50). No club since 1998 won a flag with a below average defence (conceding more than average, per inside 50).
A small number of runners-up ended up slightly below average on one of these measures as well – West Coast 2005, St Kilda 2010 and Sydney 2014 on offence and Melbourne 2000 and Port Adelaide 2007 on defence. Interestingly the teams on this list include two very close losses and the losers of three of the most lopsided grand finals in modern memory.
Below are the top twenty highest rated sides of the 1998-2015 era. This tells us than an all-in score of 110% is very good, that over the last 18 seasons about twenty sides have managed to be a combined 10% better than average on these measures:
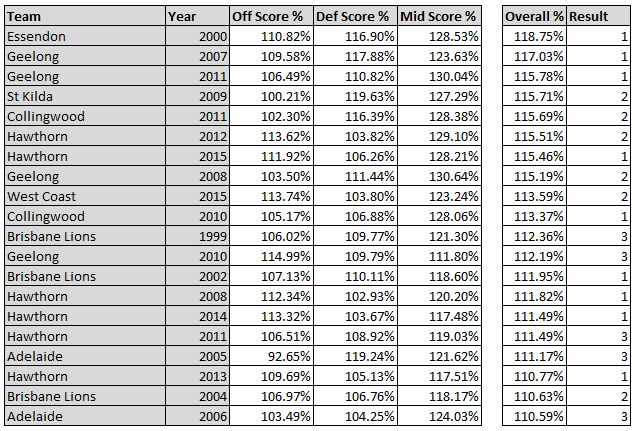
Interestingly, the Essendon side of 2000, often regarded as the best side of the modern era, also sits on top of the pile here in terms of how much better than their competition they were. Several pairs of grand finalists both feature here – Hawthorn and West Coast in 2015, Geelong and Collingwood in 2011, Hawthorn and Geelong in 2008, suggesting two sides that were both a long way above their peers in those seasons.
Adelaide in 2005 stand out as a huge outlier – Neil Craig’s ‘Crowbots’ of that season look very strong defensively and in the midfield, but very impotent offensively compared to pretty much any other top sides They present as both a higher quality but more extremely imbalanced side than the similarly defence and midfield focused Sydney of 2005.
Finally, here’s the actual tables from our 2016 ratings including movement from last week to compare to the above list:
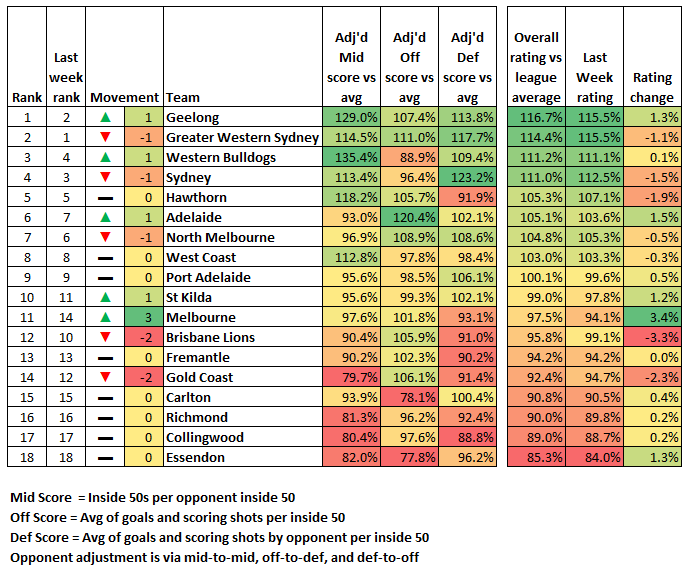
According to overall scores, Geelong, GWS, the Bulldogs and Sydney are all tracking pretty similarly to our above list of top past teams and all with a different mix of attributes from GWS’ evenness to Sydney’s defensive efficency focus to the Bulldogs and Geelong’s lopsided inside 50 ratios.
(Essendon are on track to be among the bottom ten or so sides from this same period)
Bear in mind that these are relative measures, showing how far above the competition average different clubs rate on these measures. Also, since we’re adjusting for opposition here the results are not strictly comparable with the above, meaning that if we’re underrating the softness of draws then we’re overinflating the quality of their opponents and vice versa.
Regardless, however, these measures suggest both a clearly dominant but even top end of the AFL ladder may be where we’re heading this season. This is especially the case when we also factor in Hawthorn, Adelaide and North Melbourne which show considerable strength in some areas, especially the Crows with their nearly unprecedented inside 50 efficency.
I’m loving these articles, but hating seeing my Bombers’ woes writ large in unassuageable statistics.
Can’t wait for 2017.