
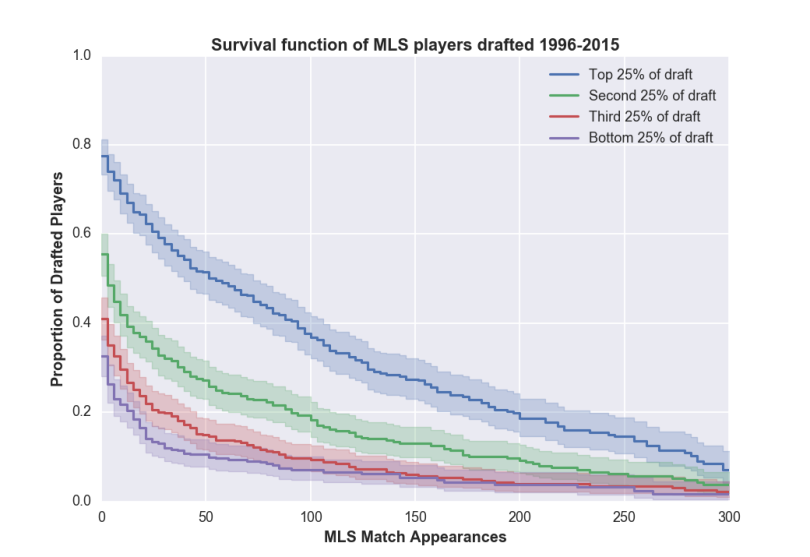
Today we’re going show a simple “survival function” analysis, inspired by a query from Soccermetrics on Twitter who ran a similar analysis of MLS draft pick career tenures.
Survival analysis shows us longevity or survival rate for players, and should prove a useful addition to other work we’ve done around draft picks and values. We have written extensively on the worth of draft picks and how to value them, and each off-season we run a series of post applying our valuation methods to trades.
To recap that work, firstly, this graph shows the average games played by each pick, illustrating the greater reliability of top 10 picks but also that pick 20 and pick 40 aren’t a hugely different value proposition:

Secondly, this graph shows us that players peak in their output in their late 20s and roughly hold their output from 26 until retirement:

Now back to survival analysis. This is another way to represent draft pick productivity. Below is the survival function for every non-current player drafted into the AFL system via the National and Rookie drafts since 1996. Each player is counted only once, with their entire career attributed to where they first entered the system:
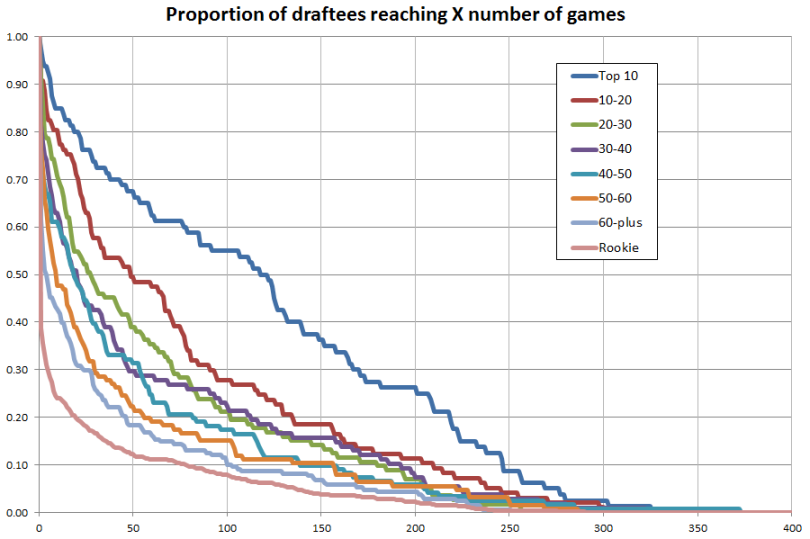
This set of players covers all non-current players drafted since 1996 in national and rookie drafts.
What we can see here is that about 55% of top 10 draft picks make it to 100 games while less than 30% of any other group does likewise. 60% of rookies never play a senior game and less than 10% of rookie picks make it to 100 games. Finding gems in the rough is a quantity game – it also involves digging up a lot of worthless rocks.
In the week after he broke the career games record, it’s worth pondering just what a spectacular outlier Brent Harvey – pick 46 in 1995 – has been against this backdrop.
If we look at the 150 and 200 game marks we can see everything from top 10 picks to late draft picks start to collapse together into a sub-20% survival rate, while top 10 picks have far lower attrition. Twice as many top-10 picks go on to play 250-games as players from anywhere outside that range.
Top 10 picks matter, and if we refer to the draft pick value chart above we can flesh this picture out by noting that top-3 picks matter more than that. The first chart shows that top 3 picks have a significantly higher number of average games, while later top 10 picks average only a bit over 100. The benefit gained by early picks is reliability and lower risks in selections, because there’s a far greater possibility of a top-10 pick contributing a significant number of games to their club.
This really looks pretty similar to Soccermetrics’ work on quartiles of MLS draftees in terms of early careers, but it looks like a lot more soccer players survive to 300 than AFL players do, with AFL players dropping off more quickly after 200 games. This is likely explained by the MLS season lasting for around 50% more games.
At any rate, we hope this adds usefully to the picture we have been building of draft pick value and productivity.
Things to watch this week
1. Port Adelaide (should) hate stoppages
With Paddy Ryder suspended and Matthew Lobbe injured since round 5, Port Adelaide have tried to fill the ruck gap with makeshift players, mostly Jackson Trengove after a hilarious (but successful given the 40 point win) experiment with a zero-ruck setup in round 6. Unsurprisingly, they have mostly struggled to get anywhere near breaking even in getting first hands to the ball:
In no game since Lobbe was injured have Port won the hitout battle, but there does appear to have been some development in Trengove’s ruck game in recent weeks. He’s approaching where Bulldogs fill-in ruck Jordan Roughhead ended up last year, without the potential to develop for another year.
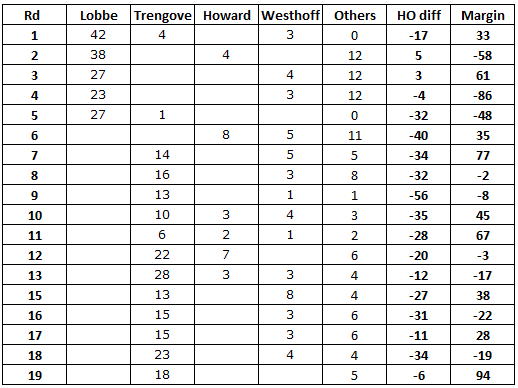
When we graph Port’s ruck data and results, including total hitouts per match as a proxy for stoppages, something interesting emerges:
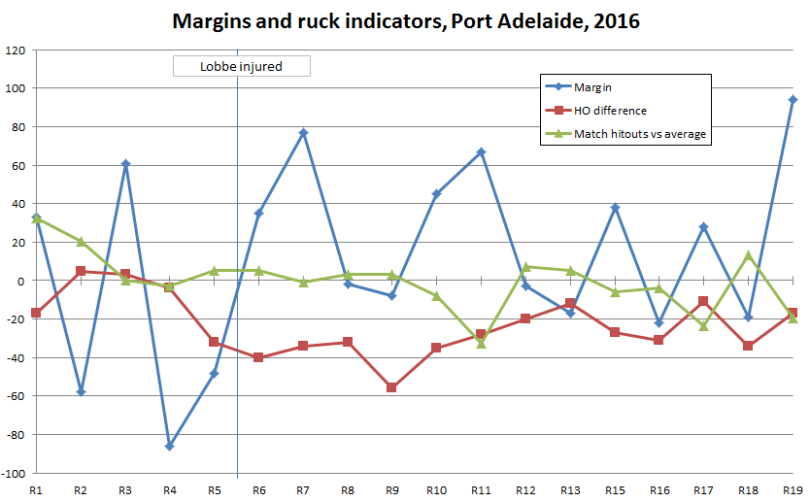
This is by no means a conclusive bit of statistical rigour, but it appears that Port Adelaide do better in matches with less stoppages. Their games have averaged 83 total hitouts over the season, and since Lobbe lost they’re yet to win a game with more hitouts than that, regardless of the hitout differential. The only game with fewer than 83 total stoppages they’ve lost was against Hawthorn in round 16 (79 total).
This doesn’t bode terribly well for the match against Sydney. Sydney have played a stoppage heavy game this year, with the fourth most hitouts in their matches. Despite the number of stoppages, Sydney have only been an average hitout-winning side, and that’s held pretty steady from the Tippett period through to the Naismith/Nankervis period. Even with inexperienced rucks as opponents, Port’s best hope is surely to continue their style of keeping the ball alive and out of congestion at all costs.
2. The “derby upset” is a statistical myth
We can only take credit for asking the question here, but Tony Corke of Matter of Stats tells us that the idea that “form goes out the window in derbies” isn’t true. In fact, according to his modelling, Adelaide and Perth derby games have been on average slightly easier to predict than other games.
3. Only Hawthorn are mathematically certain of finals
Let’s talk about mathematical certainties.
In the last few weeks the possible finalists for 2016 have thinned out significantly. Already eliminated from finals contention are Essendon, Brisbane, Fremantle, Carlton, Gold Coast and last week Richmond. This occurred when their “Tragic Number” reached zero, and there was no mathematical chance of making up the lost ground.
On the other hand, only one side has clinched a spot in September so far: Hawthorn.
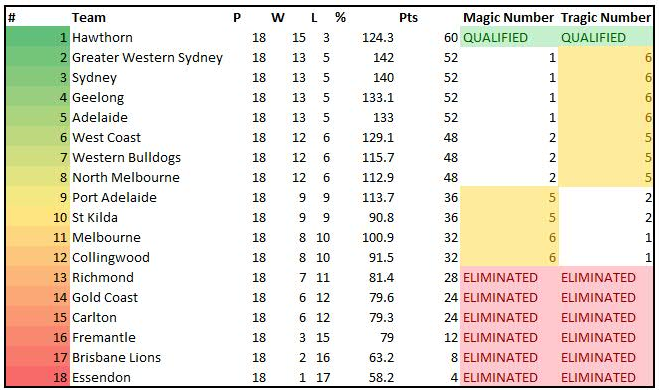
Below is a table of each team and their “magic numbers” – how many wins they need to be certain of finals. Magic numbers are defined relative to the highest placed team currently outside a finals spot. With 4 games left, 56 points puts Hawthorn clear of 9th-placed Port Adelaide while the other teams could still drop out if they lost every game.
Four other teams can join Hawthorn by winning this week, and a further three can qualify if they win, and a couple of combinations of the four teams currently outside of the eight losing. Port Adelaide, St Kilda, Melbourne and Collingwood are now zero chance of clinching before round 23 finishes because they cannot get enough games clear of 9th before then.
If Richmond beats Collingwood tonight, the Pies will officially be knocked out of finals contention. Sydney have a chance to lock up their finals spot, and to also deal a near fatal blow to Port Adelaide. Melbourne need to beat Hawthorn to stay mathematically alive. GWS can lock up finals by beating the eliminated GC, as can Adelaide over Brisbane and Geelong over Essendon.
The North-Dogs, Carlton-St Kilda and Fremantle-West Coast games are critical, but are not elimination/confirmation games at this point.