
At HPN, we don’t have a great acceptance of conventional football beliefs that aren’t backed by hard evidence. Cliches are often repeated by the football commentariat without much thought to where they originated, or whether they originated in fact.
And if we had a dollar for every time we’d heard the phrase “premiership quarter” breathlessly spouted by an ex-footballer drowning in his own flop sweat, we’d be very rich men indeed.
So we thought we’d take some time to see if the third quarter is really the premiership quarter, or if it was the fanciful creation of a television pundit short on content for the week.
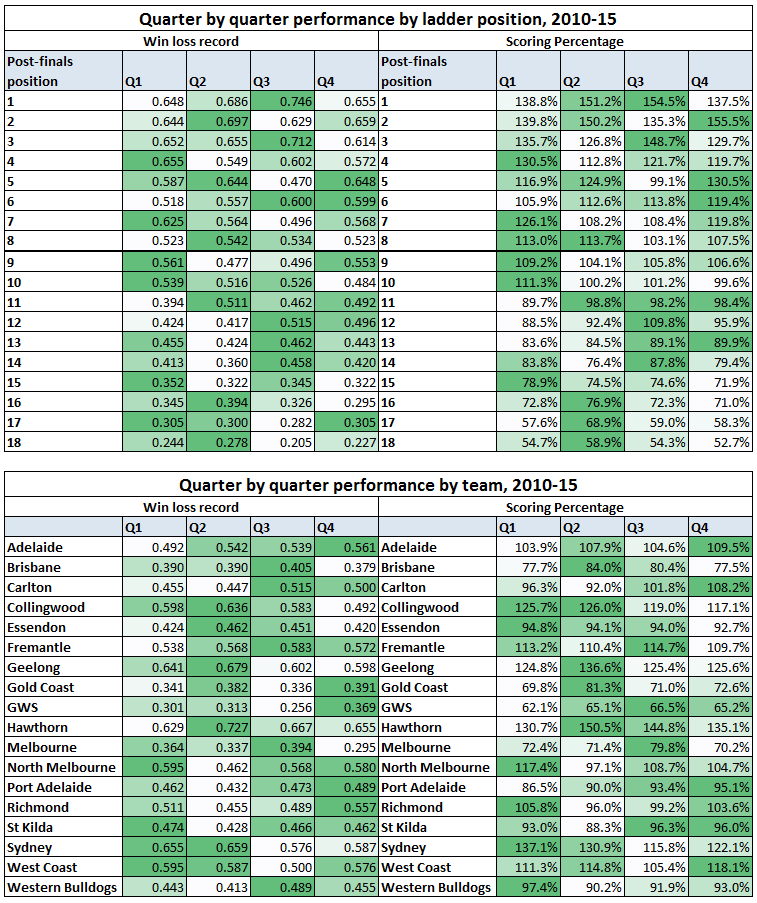
On the top two charts here we’ve used the post-finals ladder to check finals performance and not necessarily home and away performance, which is important because we’re looking for premiership performances, and not minor premier performances.
Sometimes data surprises you. Logic would indicate that the most important quarter is the final one, as it is the one that ultimately sorts the winners from the losers. But, as clearly indicated above, the true quarter of dominance for eventual premiers is the third quarter. Indeed, the second quarter is often more important to the best team rather than the last, which makes you question why. Over the last six seasons the eventual preliminary finalists have had an inferior 4th quarter performance to the previous two quarters, indicating that good teams take their foot off the gas once a game is won, and there’s little left to lose in real terms.
Conversely, a lot of the higher ranked non-finalist teams tend to do better in the final quarter, and the less important first, where the game often can’t truly be won. This is probably the stuff of “plucky”and “gallant” performances so often associated with decent non-finalist sides.
It’s also interesting that the second best team in the third quarter tends to be the third placed side on the ladder, whilst grand final losers have tended to do worse in the third quarter. Perhaps third place post-finals is often occupied by a side as good as the runner-up, the best team who slipped up along the way.
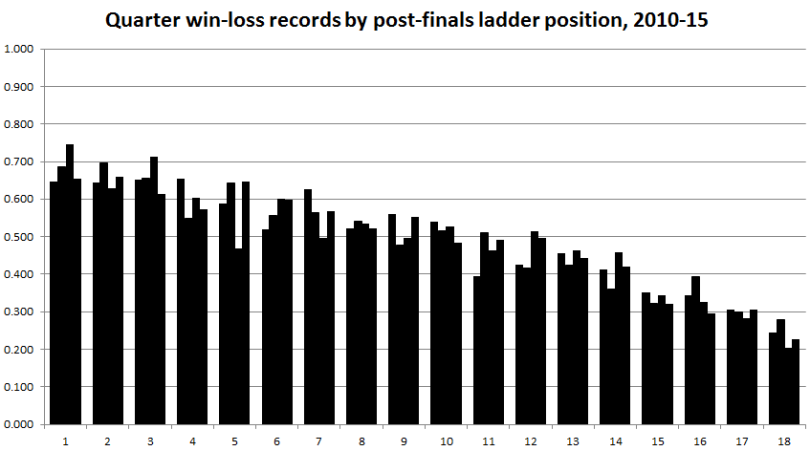
This season Adelaide has the best record in the third quarter, followed closely by Sydney and GWS. Hawthorn, by contrast, has only won 12 out of its 20 premiership quarters.
Sometimes it’s great to put together and analyse data and be completely surprised, as we were above.
Things to watch
1. The Opponent-adjusted Coleman Race
Earlier this year we took a look at adjusting the Coleman race by the defensive stinginess of goalkickers’ opponents and how they fared agains ttop 8 sides versus bottom 10 sides. At that point we identified Josh Jenkins as upping his output against top sides and having been more valuable than then-leader Lance Franklin.
Here’s an updated table of every goalkicker over 35 goals this year, and how much their opponents impact on their scoring:
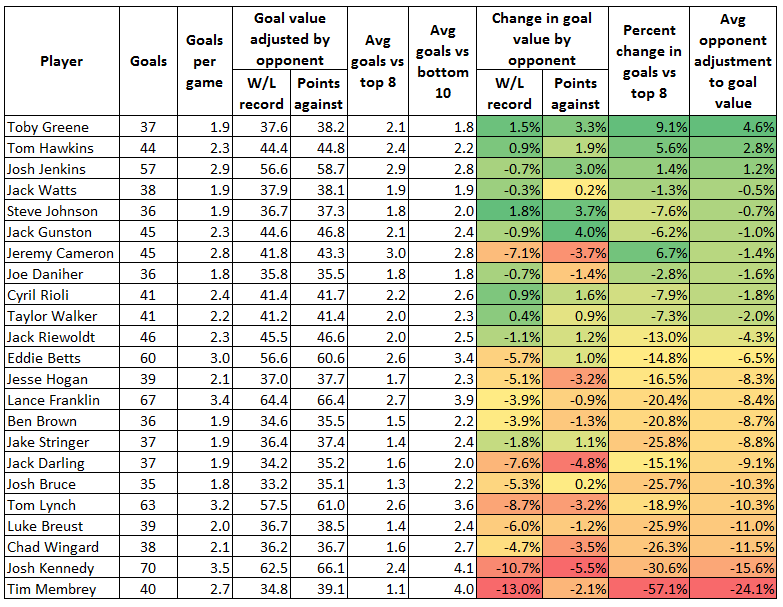
Josh Jenkins still holds up better than most other big forwards, but is now bested by Tom Hawkins and Toby Greene. Toby Greene, this year at least, emerges right now as king of the big game, kicking 2.1 goals per game against top 8 sides and 1.8 goals against the rest. This fits his talented dirtbag persona to a tee, we feel.
Down the other end, Josh Kennedy continues to look a bit flat-tracky, with other forwards whose output declines markedly against quality opponents including Chad Wingard, Luke Breust and especially Tim Membrey.
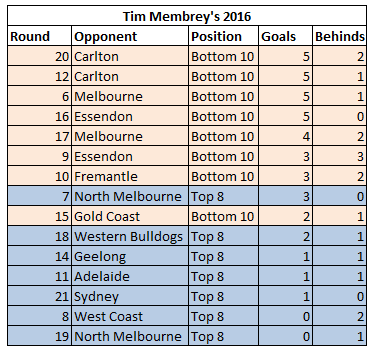
Tim Membrey has emerged this season as a sort of patron saint of flat-track bully forwards. He has a nearly 60% decline in output against top 8 sides relative to the bottom ten. He has kicked four bags of five against bottom sides in a season that looks like this:
Moving to an adjusted Coleman ladder, we again find our leader differs from the raw goal tally frontrunner:
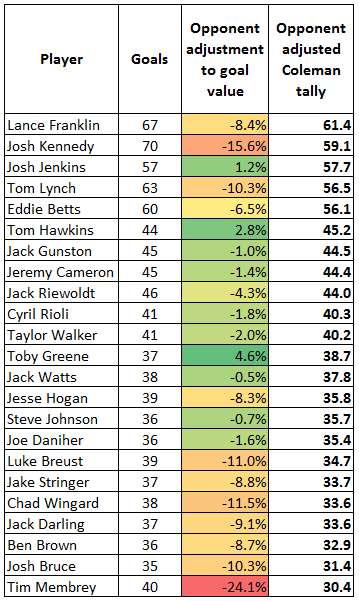
Yep, this time it’s Lance Franklin out in front of current Coleman winner-apparent Josh Kennedy. Jenkins is also nipping at their heels due to his more valuable goals.
Watch the next two weeks and see if:
- Kennedy can defy the labels and dine out against quality opponents in West Coast and Adelaide)
- Whether Jenkins can keep up his record by only going okay against Port and then a fair bit better against West Coast
- How much Franklin’s vaunted move up the field impacts his output against North Melbourne and GWS, games which will scale decently.
2. Magic Number
This one is really easy, and really brief now. There’s no need for a graph or a chart.
If North Melbourne wins either of their last two games, they make the finals. They also make the finals if Melbourne or St Kilda lose either of their games. Or if St Kilda fails to win both games by about 20 goals.
It is conceivable that Melbourne wins the last two games of its schedule, but it is unlikely and they still have a percentage gap to make up. Still, it would be a remarkable fall if North managed to miss the finals after their hot start to the season.