
With the 2016 regular season almost wrapped up we thought we would take a look at how it fits into the context of the ongoing statistical evolution of our game. The recent era has been one of flux, driven by the delicate interplay of improved conditioning, tactical innovation and rule changes. Below is a chart showing some key indicators of style across four main themes (disposals, stoppages, scoring, and marking):
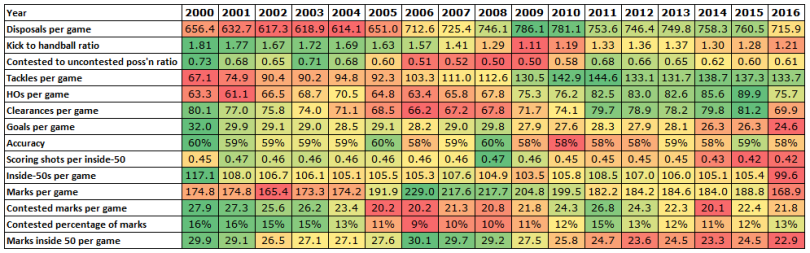
The red and green cells show us the maximum and minimum values for each item across the period. For example, in 2016 inside-50s per game are as low as they have been at any point.
There’s a lot to comment on here, so we’ll move through each theme in turn. The charts below index each value to a base of 100 and thus show us what’s moved up and down since then.
Disposals
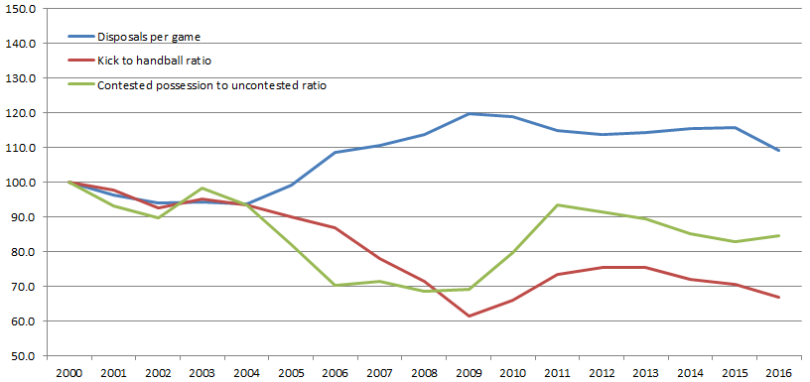
The game seems to have become first faster and then more pressured across the period.
Up until 2009 pace and space became the name of the game. The story of football was dominated by more kicks, more uncontested footy and more disposals per game. Disposals per game peaked at the same time as kicks per handball, with uncontested possession per contested possession also at its highest in this period.
Since then, disposal counts have dropped back a little, the story being a decline in kicks rather than handballs. The last few years have been dominated by catchcalls such as “contested disposals winning premierships”. Simultaneously, uncontested possessions declined as a share of the total, and handballs became more frequent. This can best be explained due to the following:
Stoppages
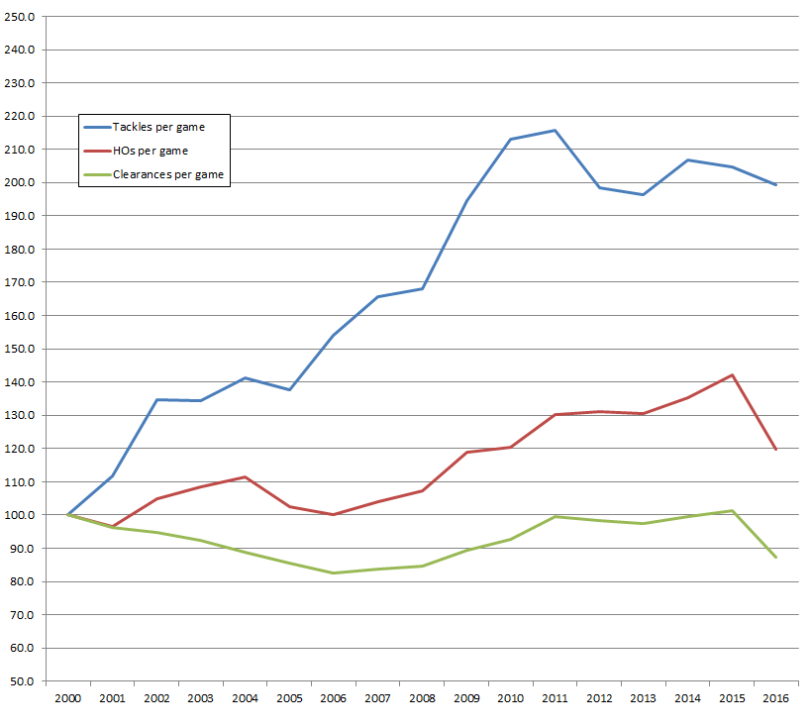
We’ve had to expand the scaling here to show the sheer magnitude of tackle count increases. Whether it’s fitness, defensive structures, tactics or the desire to apply pressure, tackling has utterly transformed the sport. There’s a possibility of a slight methodology change in this time, but nothing obvious that we have found in our research.
Tackles really started increasing in 2002 but really rocketed up after 2005, reaching a peak in 2011 of nearly 220% of their 2000 levels. This is the single most dramatic change over the period in any statistical category we looked at. If we refer above, we can see that the post-2009 era of very high tackle counts probably has a lot to do with the move to lower disposal counts and higher contested possession and handball levels. It appears that players started closing down space and protecting contests a lot better.
It’s also worth remembering this whenever you hear commentators and former players lamenting that the contents and tackling has gone from the game.
For example, we remember the 2005 grand final as a dour defensive contest, but the tackle count in that game was 62-59, 121 tackles total, below the game average for every season since 2009.
Note also the growing gap between hitouts per game and clearances per game. Hitouts and stoppages rise with tackles obviously, but this is the rise of repeated stoppages where a stoppage hitout leads to another stoppage hitout rather than a clearance. This is also likely the reason for the rise in value of ruckman who primarily specialise in hitouts, and the value to recruit tall athletes who may not have AFL experience in the past.
This season shows a sharp decline in hitouts and clearances that almost certainly reflects the changed interpretation of deliberate out of bounds, and an apprehension for most players and teams to concede easy free kicks from it.
Scoring
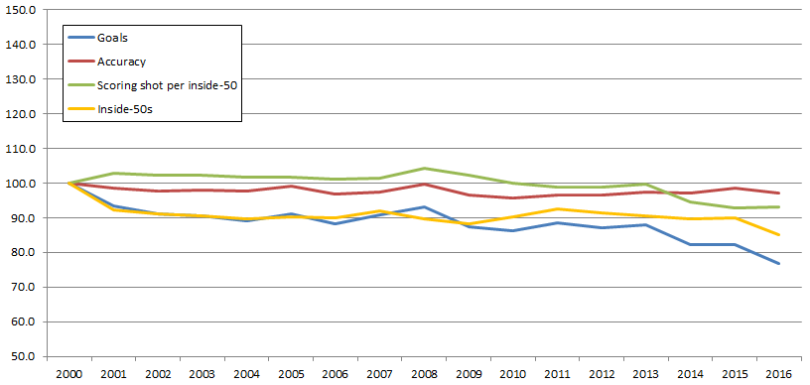
Actual scoring has held up remarkably well given the context of such increased pressure around the ball. Goals have declined about 20% since 2000, but only in line with declining inside-50s, and those are driven no doubt by improved tackling and stoppage defence.
Scoring shots per inside-50 are down about 5% across the period, illustrating the greater difficulty of obtaining clear scoring opportunities. Accuracy is basically flat despite all this. We’d love to know if shot difficulty has increased (Rob Younger at @figuringfooty might be able to work it out), but it likely has given the following:
Marking
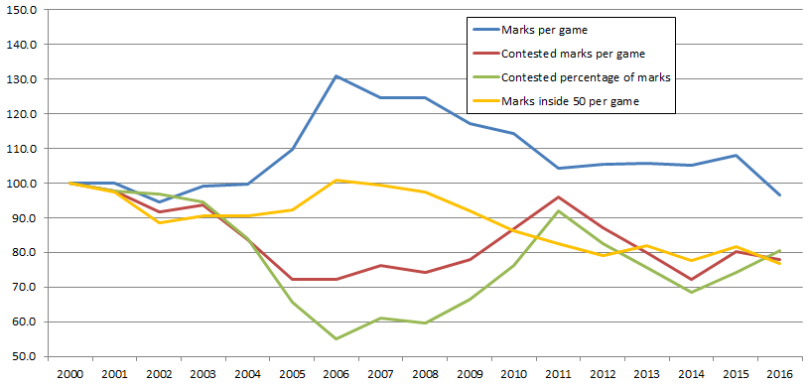
Marks inside 50 per game are down 20% from 2006. This possibly explains the decline in both accuracy and scoring shots per inside-50. Defences, and defensive structures, have come a long way in a decade and a half.
Marks per game themselves are also down from a boom period between 2006 and 2011. Contested marking was as good in 2011 as it had been since 2003, but has been a bit up and down since then.
For us though, everything seems to go back to tackling. A twofold increase in tackling has to be driving a lot of other change in the sport, and we think it’s reflected in many or most of these other developments.
Since its creation and formalisation over 150 years ago, the game of Australian Football has continually changed and evolved, often to the protests of “traditionalists”. However, one of the brilliant things about football is the fact that it is a living, breathing sport, full of new ideas and advancements. At HPN we see this evolution as inevitable, and often for the best.
Things to watch this week
Shuffling the deckchairs
With Melbourne choke-failing against Carlton last week in inexplicable circumstances, the final eight is officially set. However, some interesting games present themselves this week.
GILESMENTUM returns tonight, with the Crows likely needing to win to secure at least a top two spot, with a loss putting them at jeopardy of missing the top four. If the mighty Jono Giles can lead the Eagles to victory, the Eagles will secure a home final at worst, and potentially fourth place at best (percentage differential rules them out of rising higher).
Geelong needs to win to secure a top four spot, with the possibility of going top two if results go their way. If Melbourne wins (somehow), they will finish with wins in 50% of games for the first time since decimal currency was introduced.*
For GWS to finish in the top four, they need to beat North Melbourne, and hope that one of Adelaide, Geelong or Hawthorn loses. Hawthorn are an outside chance of dropping to seventh with wins by GWS, West Coast and a 40+ point win by the Bulldogs. Finally, Sydney will finish on top with a win, and will likely not fall further than fourth (barring a massive collapse and a big GWS win).
Past games!
As well as watching this week’s games, we suggest watching some games from the recent past with these statistical evolutions in mind.
To get you started, here’s a random game from 2001 between decent tackling sides of that year. Each side had about 30 tackles and the result was close with scores well above 100:
Here’s a game from 2005 under Neil Craig, one of the better defensive sides of the modern era as per our ratings system. Again the tackle count was low and the scoring was high:
And here’s the 2010 grand final, just 6 years ago:
#bruisefreefootball
* Not factually accurate.