

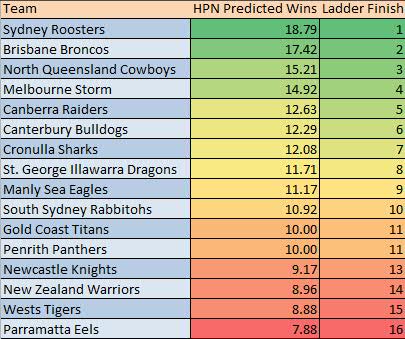
If you’ve clicked on this article from another website (such as Twitter or Reddit), you will have likely seen the lead image as a thumbnail. Yes, the one with the much maligned Roosters as the eventual minor premiers. No, we aren’t trolling.
Even as I type this the odds of a dominant season by the Roosters slip by the wayside. In the off-season the side lost Michael Jennings, James Maloney, Nathan Stapleton and Roger Tuivasa-Sheck, with Mitchell Pearce under a continual cloud from his brief stint in short film. In their stead, the Roosters were able to recruit Joe Burgess (an England rep), Dale Copley (an emerging Maroon) and journeyman hooker Ian Henderson. While that’s a decent replacement haul, it’s not exactly like for like. At the time of writing, Sportsbet have the Roosters as the 10th favourite for the minor premiership. We at Hurling People Now respectfully disagree with this dramatic fall from grace, but perhaps not entirely.
Before digging ourselves further into a hole, let’s explain how we got to such a point.
Methodology
How HPN predicts ladders can be explained pretty simply in three parts:
- Strength of team last year;
- Strength of schedule this year; and
- Influence of “lucky results” last year.
Let’s break those down now.
Strength of Team
Contrary to common perception, there is a limited amount of movement in any teams’ 25 man primary squad. As indicated in the chart below, the vast majority of every NRL team’s 2015 squad stayed intact from last year.
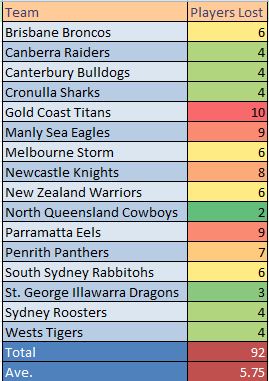
In general terms, 77% of each teams’ squad has stayed in place from last season. Roughly speaking, this indicates that a team’s performance last season should be generally indicative of their performance this season. This simple analysis doesn’t account for the quality of players lost or gained, however the implementation of a relatively small salary cap should mitigate this factor.
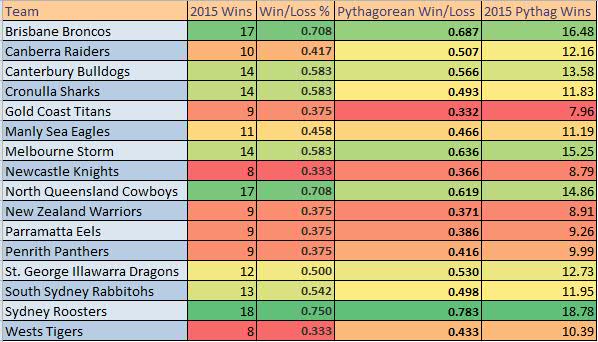
In addition to just win/loss records to last year, we’ve also added Pythagorean win/loss, an expected win/loss measure. Essentially this evaluates how many games a team “should” have won based on their scoring and conceding of points. This previous (AFL) post explains the theory more, and we’ve loaned the exponent from Tony Corke at the Matter of Stats Blog (1.89 for those playing at home).
Team strength based on 2015 win/loss and on Pythagorean expectaions
Strength of Schedule
The 24 game NRL season means that each team has to play nine teams twice, and six teams just once. This creates an inherently inequitable draw by design. But how uneven is it this year, and who benefits from it? The tables below take 2015 records and tells us the strength of each team’s 2016 draw (both standard win-loss and Pythagorean win-loss), expressed in its impact on expected wins versus a fair draw.
First, here it is based on win-loss records:
Strength of Schedule – Win-loss records from 2015 applied to 2016 draw
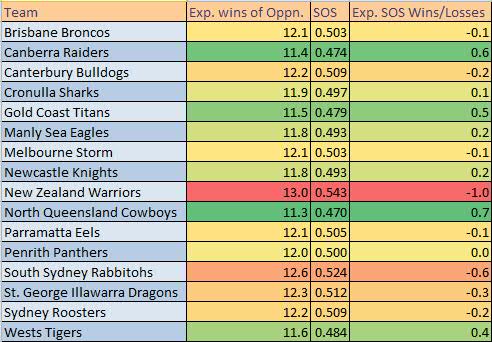
And then on the pythagorean expectations calculations:
Strength of Schedule – Pythagorean win-loss from 2015 applied to 2016 draw
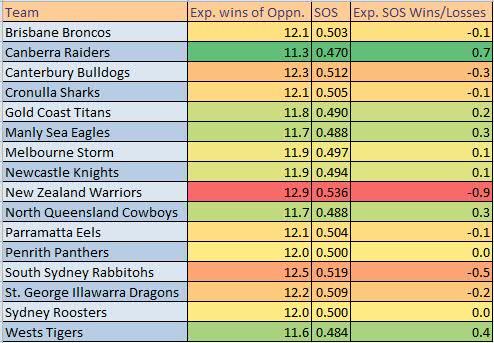
New Zealand is handed a terrible draw this year, with very few repeat games with the 2015 cellar dwellers. On the other hand, Canberra and Gold Coast have been given a relatively easy run, starting out with an about 1.5 win head-start on the Warriors on draw alone (given equal strengths of their own teams).
Influence of “lucky results”
As outlined by the great Bill Barnwell in his analysis of NFL results, games decided in that code by less than a score generally can considered to be coin-tosses when it comes to the final outcomes. A team that wins a large share of its close games in one year has registered an extreme or outlier result and is relatively unlikely to repeat it next year, and vice-versa with a large number of close losses. The simplistic (and not always correct) term for this tendency for an extreme result to be closer to the average next time is called “regression toward the mean”.
On the assumption that a team should win around half of their close games, we’ve adjusted their prediction for those results. Here’s how each team did in close games last year and what happens if their luck regresses to the mean instead:
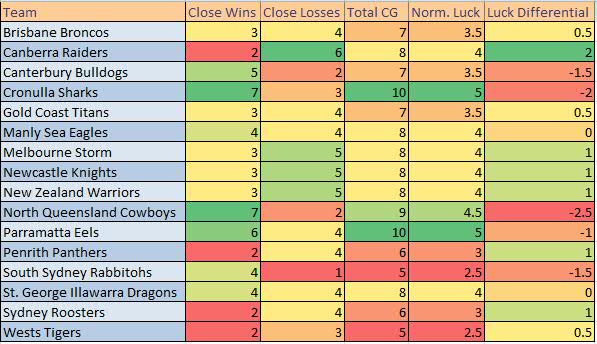
Interestingly the Roosters probably should have won even more games last year than they did. However, it’s the Green Machine that gets the biggest benefit from this measure, having lost a slew of games by a try or less. The Cowboys and Sharks slide down the ladder on this measure, having won several more close games than they lost.
Summary
This method of prediction isn’t perfect – it’s quite simplistic in nature and is probably best used as an indicator of how teams will go as compared to last season, rather than a holistic view of every factor inputting to a team’s final performance.
According to our model, the Roosters shouldn’t do as badly as most punters think, the Raiders should be a bolter into the eight, and there will be a logjam at the edge of the finals. The model seems to indicate that there is a clear top tier (Roosters, Brisbane, North Queensland and Melbourne), followed by eight teams separated by very little.
If you want to look at potential holes in the model, they would be centred on the high turnover of personnel at Gold Coast, Manly, Parramatta and Newcastle, which makes their performance a little more unpredictable. Note that none of those four teams made the finals last year.
One last time – the HPN prediction of the 2016 NRL ladder: